Technical Analysis for July 2nd, 2025 - Option Matrix India
Welcome to Option Matrix India! Here's our detailed technical analysis for the Indian Stock Market, specifically focusing on Nifty and Bank Nifty for July 2nd, 2025. Our aim is to provide you with actionable insights and precise predictions to navigate the derivative market. Nifty has created an Inside candle on the daily timeframe; will we witness a major movement tomorrow? Technical Analysis by Option Matrix India
(No Bullish trade in bearish candle, no bearish trade in bullish candle – A core principle for disciplined trading.)
Key Observations of Market Closing - July 1st, 2025
The Indian stock market on July 1st, 2025, showed a largely flat to bearish sentiment, aligning with global cues. Let's break down the key figures:
- Nifty:
- Today's Market Closed at: 25541.8
- Today's Market Range: 25501.8 to 25593.4
- Opening: 25551.35
- Volume: 260,621,848
- Daily Chart: Inside candle formation, indicating indecision or consolidation after the previous day's movement.
- Bank Nifty:
- Closing: 57459.45
- Range: 57150.35 to 57533.85
- Opening: 57375.8
- Volume: 283,254,119

Global Cues and Macro Factors
Understanding the broader market environment is crucial for effective market analysis. Here's what's influencing the current sentiment:
- Crude Oil Price: Holding at $65 per barrel. Stable crude oil prices can have a mixed impact on the Indian economy, influencing inflation and corporate earnings, especially for oil-sensitive sectors.
- Rupee near 85.47: The Indian Rupee trading near 85.47 against the US Dollar indicates a depreciating rupee, which can impact import costs and export competitiveness. This is a key factor for the derivative market as it affects foreign institutional investor (FII) flows and overall market sentiment.
- European Market: Flat to Bearish.
- Dow Future: Flat to Bearish.
The global flat to bearish sentiment, particularly from European markets and Dow futures, suggests a cautious approach is warranted for the Indian Stock Market. Traders should remain vigilant of any sudden shifts in international sentiment that could spill over.
Our Previous Analysis: Dot-to-Dot Performance
Our prior analysis highlighted critical levels, and it's imperative to review how the market respected these zones. Today's price action largely validated our technical outlook, particularly around the no-trading zone. The market's inability to decisively break out of these levels confirmed the importance of our identified ranges. This reinforces the precision of our market analysis and the effectiveness of our approach in identifying key support and resistance levels.
Tomorrow's Market Prediction - July 2nd, 2025
Based on today's closing and the observed patterns, we anticipate specific scenarios for July 2nd.
For Nifty:
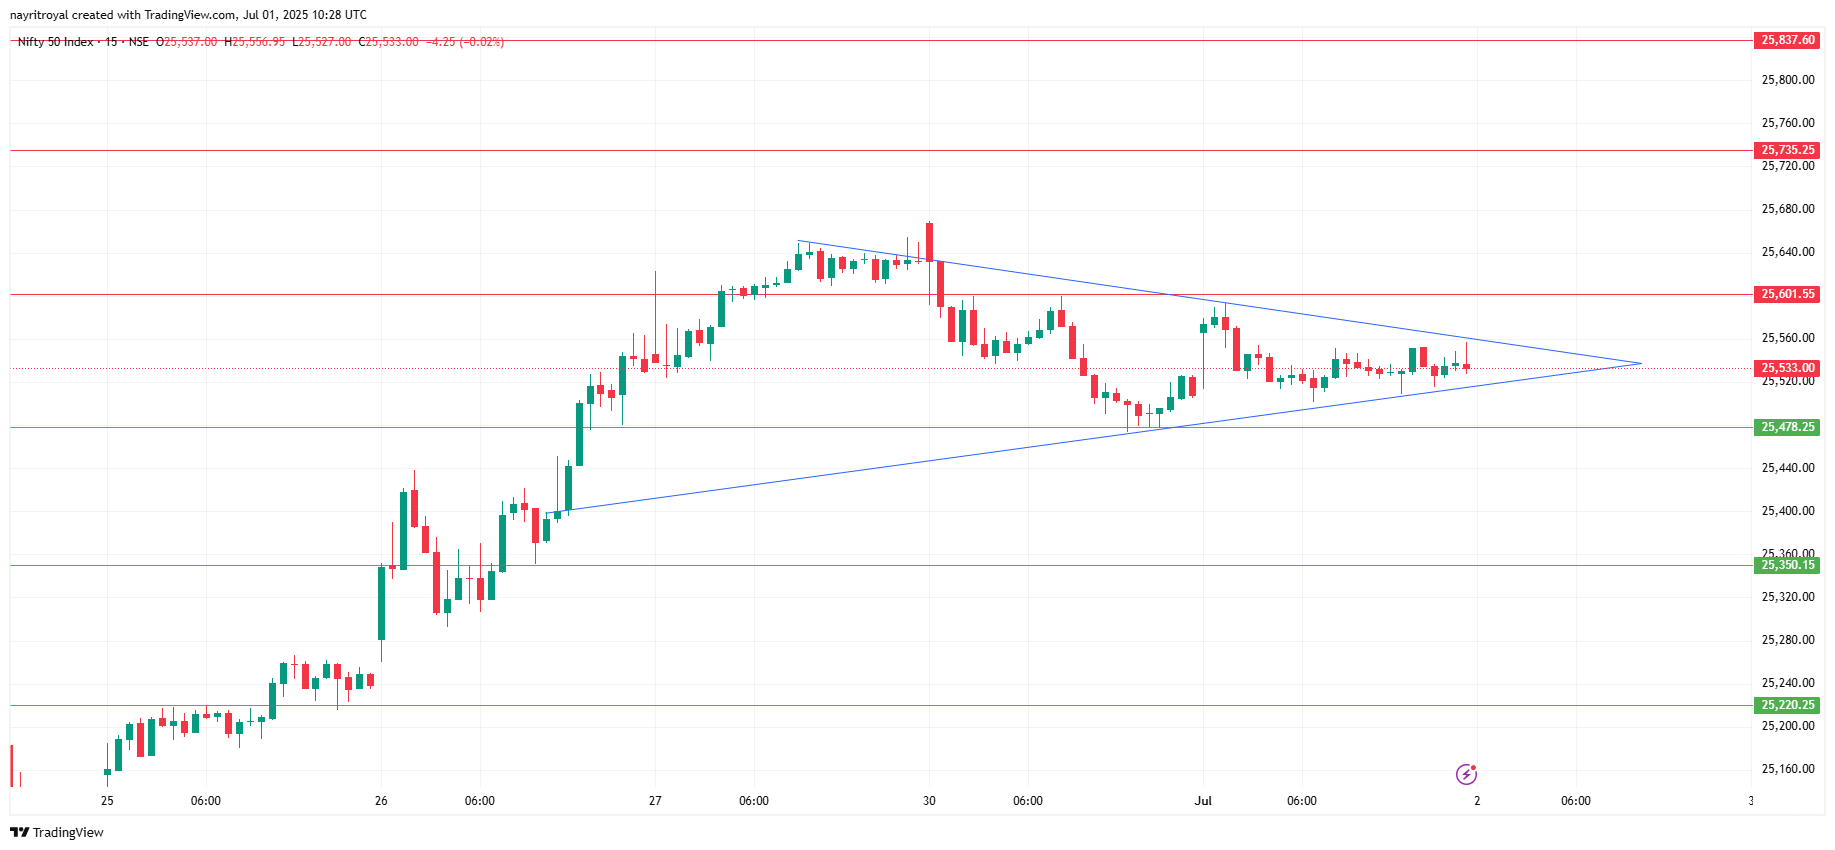
- No Trading Zone: We reiterate our "no trading zone" between 25477 and 25602. Entering trades within this range carries higher risk due to potential whipsaws and lack of clear direction.
- Bullish Scenario (Breakout Above 25602): If a 15-minute candle closes above 25602, it would signal a bullish momentum.
- 1st Target: 25737
- 2nd Target: 25834
- Short-Side Scenario (Break above 25602 but close below): If a 15-minute candle crosses 25602 but closes below it, this could indicate a fake breakout and a potential reversal to the downside.
- 1st Target: Today's closing (approximately 25541.8) or 25500
- 2nd Target: 25350
- Bearish Scenario (Close Below 25475): If a 15-minute candle closes below 25475, it would confirm a bearish trend.
- 1st Target: 25350
- 2nd Target: 25220
- Upside Scenario (Cross 25475 but close above): If a 15-minute candle crosses 25475 but closes above it, this might indicate a support retest and a bounce back.
- 1st Target: 25550
- 2nd Target: 25670
Trade Recommendations for July 2nd, 2025
Given the defined zones and global cues, our trade recommendations are as follows:
- Avoid trades within 25477 to 25602 on Nifty. This range is characterized by uncertainty, and the risk-reward ratio is not favorable.
- For long positions on Nifty: Only initiate a bullish trade if a 15-minute candle definitively closes above 25602. Strict stop-losses are advised, preferably below the breakout candle's low.
- For short positions on Nifty:
- Consider shorting if a 15-minute candle crosses 25602 but fails to close above it, indicating a false breakout.
- Also, consider shorting if a 15-minute candle closes below 25475. Ensure your stop-loss is placed above the high of the breakdown candle.
- For bounces from support on Nifty: If a 15-minute candle crosses 25475 but closes above it, a short-term long position can be considered with a tight stop-loss below 25475.
Important Note: Always adhere to the principle: No Bullish trade in a bearish candle, no bearish trade in a bullish candle. This helps to avoid counter-trend trades and improve conviction.
Final Verdict
The Indian Stock Market, particularly Nifty and Bank Nifty, is currently in a phase of consolidation, influenced by flat to bearish global cues. The "inside candle" formation on the daily Nifty chart underscores the ongoing indecision. While specific price levels provide potential trading opportunities, a disciplined approach is paramount. Patience and strict adherence to entry/exit criteria based on 15-minute candle closes will be key to navigating tomorrow's market. Volatility might pick up around the defined breakout or breakdown levels.
Technical Analysis 2nd July 25 End
Disclaimer
This article is for informational and educational purposes only and does not constitute financial advice. Trading in the derivative market involves substantial risk and may not be suitable for all investors. The information provided here is based on technical analysis and current market conditions, which are subject to rapid change. Past performance is not indicative of future results. Before making any investment decisions, please consult with a qualified financial advisor. Option Matrix India and its authors are not liable for any losses incurred from trading based on the information presented here.