Mastering Multi Time Frame Chart Analysis in Financial Trading
By Option Matrix India (OMI)

In the fast-paced world of financial trading, precision, timing, and context are everything. Traders who rely on only a single time frame often miss the broader picture, leading to premature decisions or missed opportunities. This is where Multi-Time Frame (MTF) Chart Analysis comes into play—a powerful technique that provides a holistic view of market trends analysis, improving both strategy and execution.
At Option Matrix India (OMI), we specialize in advanced trading systems and strategies, and MTF analysis remains at the core of our decision-making framework. This article breaks down the concept, requirements, and practical application of multi-time frame chart analysis along with a primer on key financial trading fundamentals.
What Is Multi Time Frame Chart Analysis?
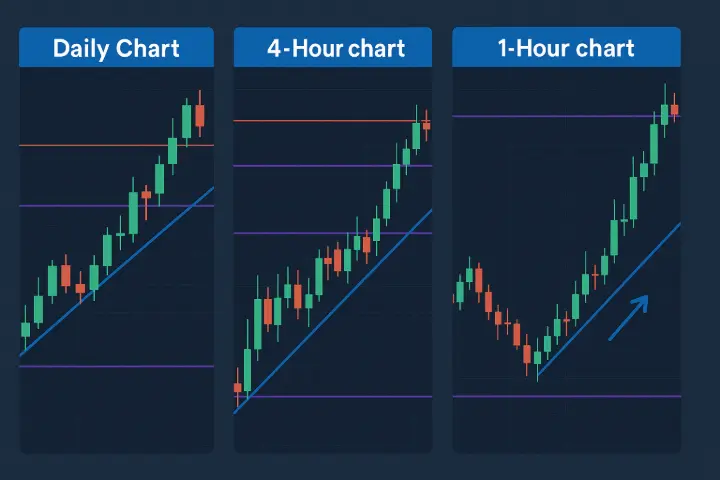
Multi-Time Frame Chart Analysis involves reviewing the same financial instrument across different time frames to gain deeper insight into its behavior. For instance, a trader might analyze a stock using:
- Monthly chart for long-term trends (macro outlook)
- Daily chart for medium-term setups (swing or positional entries)
- Hourly or 15-minute chart for short-term execution (entry/exit timing)
Each time frame offers unique insights:
- Higher time frames (daily, weekly, monthly) define the dominant trend and key support/resistance levels.
- Lower time frames (hourly, 5-minute) help in pinpointing entry and exit points with greater accuracy.
Why MTF Analysis Matters
- Improved Accuracy: Validates trend direction and filters out noise.
- Risk Mitigation: Aligns entries with broader trends, reducing false signals.
- Strategic Timing: Enhances entry and exit timing through short-term signals in the context of long-term trends.
- Versatility: Works across asset classes—stocks, options, forex, commodities, and cryptocurrencies.
Requirements for Implementing MTF Chart Analysis
To successfully perform MTF chart analysis, traders need the following:
1. Charting Platform with Multi-Time Frame Support
- A robust trading terminal (like TradingView, MetaTrader, or OMI’s proprietary tools) that allows seamless switching and comparison between time frames.
- Features like overlay charts, synchronized cursors, and split-screen views are ideal.
2. Reliable Data Feed
- Real-time data with low latency for intraday analysis.
- Historical data for analyzing long-term trends and back testing.
3. Technical Indicators Adapted to Time Frames
- Moving averages, RSI, MACD, Bollinger Bands, and trendlines need to be interpreted differently across time frames.
- Some indicators are more effective in certain frames (e.g., RSI for intraday, EMA for longer-term).
4. Clear Time Frame Hierarchy
-
Traders must define their primary, intermediate, and execution time frames.
- Example: A positional trader might use the weekly chart (primary), daily chart (intermediate), and 1-hour chart (execution).
5. Trade Journal and Plan
- Log observations across each time frame.
- Document the alignment or divergence of trends.
- Note how entry/exits align with broader trends.
6. Discipline and Patience
- MTF analysis demands waiting for all time frames to align, which can test trader patience.
- Success depends on following signals consistently.
How to Perform a Multi Time Frame Analysis (Step-by-Step)
-
Identify the Primary Trend (Higher Time Frame)
- Start with a weekly/monthly chart.
- Look for major trend direction, support/resistance, and pattern formations.
-
Confirm with the Intermediate Trend (Daily Chart)
- Validate if the intermediate trend agrees with the primary trend.
- Use indicators to identify momentum shifts or continuation patterns.
-
Pinpoint Entry/Exit (Lower Time Frame)
- Use 15-min or hourly charts to time entries.
- Look for breakouts, pullbacks, or candlestick patterns that confirm your thesis.
-
Risk Management
- Determine stop loss based on lower time frame volatility but confirm its placement using higher time frame levels.
Common Factors in Financial Trading
Regardless of strategy or instrument, successful trading depends on mastering these universal factors:
1. Trend Identification
Understanding the market’s direction—uptrend, downtrend, or consolidation—is crucial before entering any trade.
2. Support and Resistance
Key price levels where the market tends to reverse or pause. These are validated more strongly on higher time frames.
3. Volume Analysis
Volume confirms price action. An increase in volume during breakouts or breakdowns indicates strength behind the move.
4. Risk-to-Reward Ratio
Always define potential loss and profit before entering a trade. A good rule of thumb is a minimum 1:2 risk-reward ratio.
5. Position Sizing
Use a fixed percentage of capital per trade (commonly 1–2%) to manage risk.
6. Psychology and Discipline
Emotions like greed, fear, and impatience can sabotage a well-planned trade. Successful traders follow a tested strategy with consistency.
7. Back testing and Optimization
Test your strategy across historical data. MTF strategies, in particular, must show consistent performance before going live.
8. News and Macro Events
Be aware of economic releases, earnings reports, or geopolitical developments that can impact market volatility.
Conclusion: MTF Analysis with OMI
At Option Matrix India, we empower traders with advanced tools and training to harness the full potential of Multi Time Frame Chart Analysis. Our systems are designed to simplify the complexity of market analysis, enabling you to make high-probability, low-risk trades based on structured decision-making.
Whether you are a beginner or a seasoned trader, integrating multi-time frame analysis into your strategy will elevate your trading edge. Explore our custom trading solutions, live charting platforms, and mentorship programs tailored to help you master this essential technique.
Contact us today to learn more or schedule a personalized demo.