Mastering the Momentum: Your Guide to the Relative Strength Index (RSI) for Indian Markets
In the dynamic world of stock trading, having an edge means understanding market sentiment and anticipating price movements. While countless indicators promise insights, the Relative Strength Index (RSI) stands out as a powerful and widely used momentum oscillator. Whether you're an intraday trader seeking quick gains or a swing trader aiming for short-to-medium term profits, the RSI can be an invaluable tool in your arsenal.
This comprehensive guide will demystify the RSI, explain its core concepts, and show you exactly how to leverage it for intraday and swing trading, along with smart stock selection strategies, specifically tailored for the Indian market.
What is the Relative Strength Index (RSI)?
Developed by J. Welles Wilder Jr., the RSI is a momentum oscillator that measures the speed and change of price movements. It oscillates between 0 and 100, providing signals about whether a stock is overbought (potentially due for a correction) or oversold (potentially due for a rebound).
Think of it this way:
- RSI above 70: The stock has seen significant upward price momentum recently, suggesting it might be "overbought" and could be due for a pullback.
- RSI below 30: The stock has experienced substantial downward price movement, indicating it might be "oversold" and could be ripe for a bounce.
- RSI around 50: Generally indicates a neutral or sideways trend, with balanced buying and selling pressure.
The RSI Formula (Simplified for Understanding):
While you don't need to calculate it manually, understanding the underlying principle helps. The RSI compares the average of recent gains to the average of recent losses over a specified period, typically 14 periods (days for daily charts, hours for hourly charts, etc.).
RSI = 100 - (100 / (1 + RS))
Where:
RS (Relative Strength) = Average Gain / Average Loss
The average gain is the sum of positive price changes over the period, divided by the period. The average loss is the sum of negative price changes (as positive values) over the period, divided by the period.
Why is RSI Crucial for Indian Traders?
The Indian market, known for its volatility and diverse sectors, presents unique opportunities. RSI helps traders:
- Gauge Momentum: Understand the underlying strength or weakness of a price trend.
- Spot Reversals: Identify potential turning points in a stock's price.
- Filter Stocks: Efficiently narrow down a vast universe of stocks to those presenting potential trading opportunities.
- Confirm Signals: When combined with other indicators, RSI can provide stronger validation for your trading decisions.
RSI in Action: Intraday Trading Strategies for Indian Market
Intraday trading demands quick decision-making and precise entry/exit points. RSI, when used effectively, can be a potent tool.
Standard Settings for Intraday: While the default is 14, some intraday traders adjust RSI settings to be more sensitive, like 7 or 9 periods, and overbought/oversold levels to 80/20 to capture faster movements. However, for beginners, sticking to 14 periods with 70/30 levels is a good starting point.
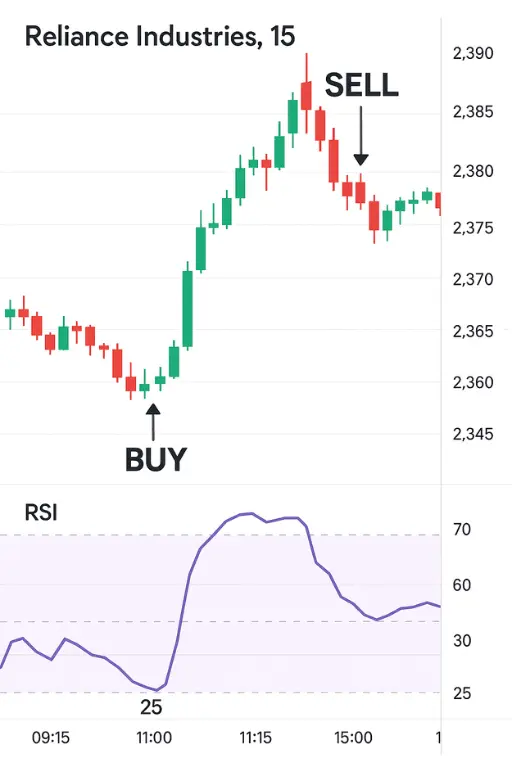
Strategy 1: The Classic Overbought/Oversold Bounce (Scalping/Quick Trades)
This is the most fundamental RSI strategy.
- Buy Signal: When a stock's RSI dips below 30 (oversold zone) and then crosses back above 30, it suggests a potential rebound.
- Sell Signal: When a stock's RSI climbs above 70 (overbought zone) and then crosses back below 70, it indicates a potential pullback.

Key considerations for Intraday:
- Timeframe: Use smaller timeframes like 5-minute or 15-minute charts.
- Volume Confirmation: Always look for high trading volume accompanying RSI signals. A strong volume surge on an RSI reversal adds conviction.
- Stop Loss: Place a strict stop-loss order just below the recent swing low for long trades, or above the recent swing high for short trades.
- Target Profit: Aim for a quick profit, perhaps at the nearest resistance/support level or a fixed risk-reward ratio (e.g., 1:1.5 or 1:2).
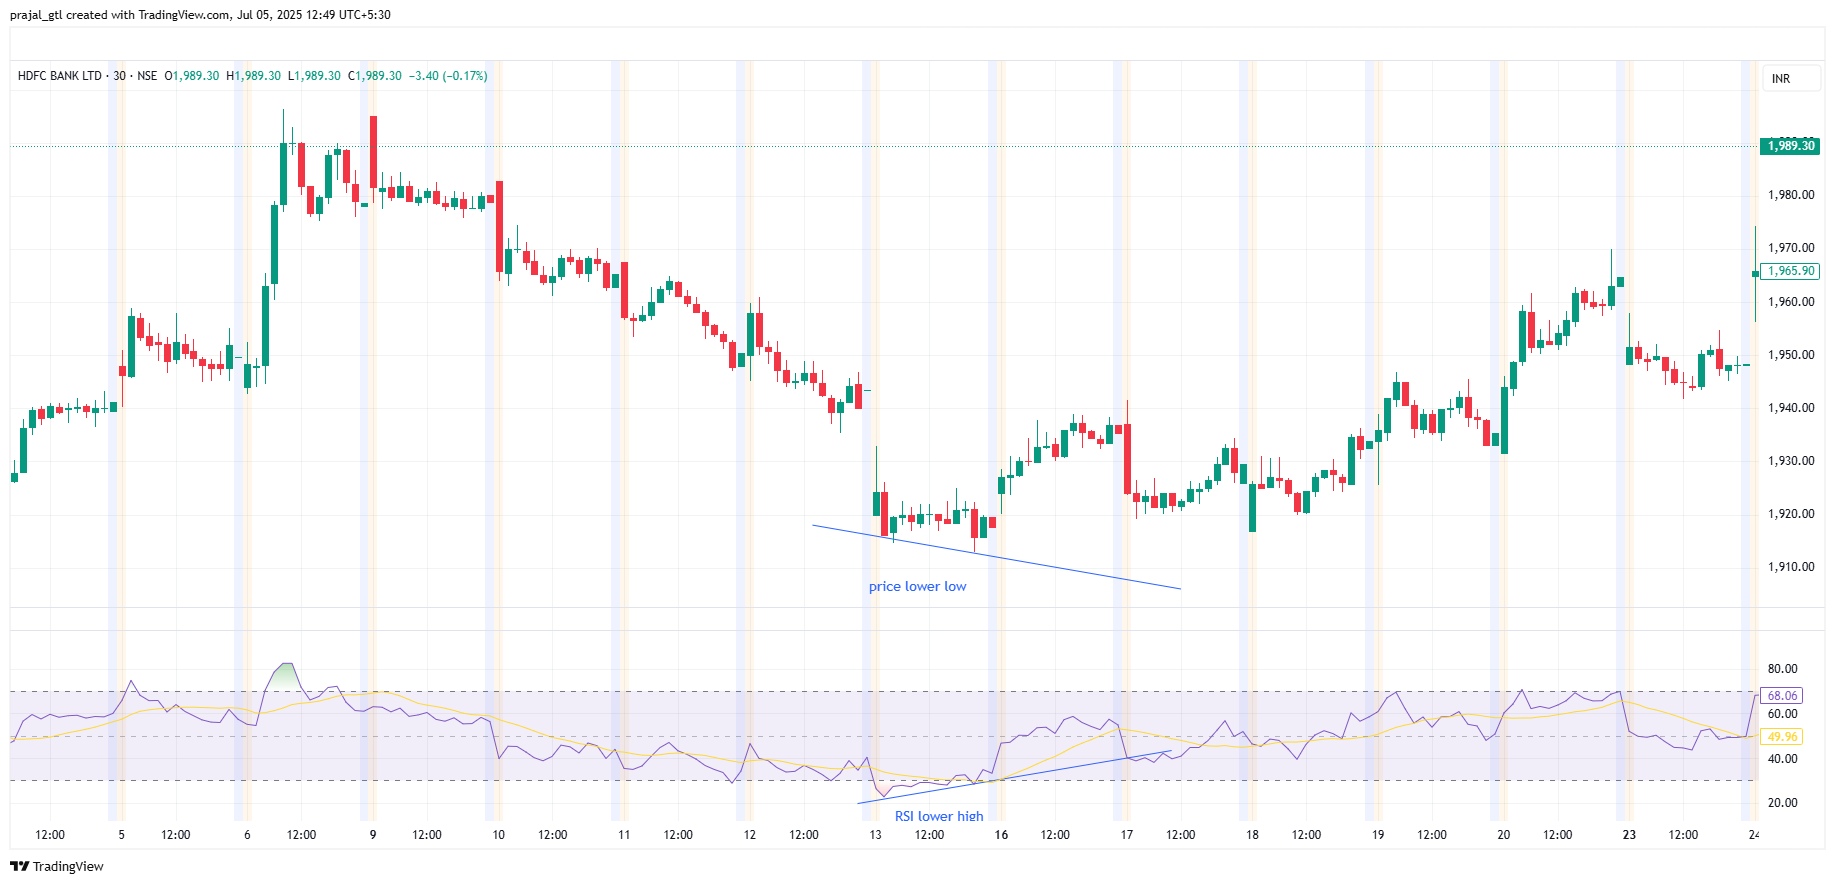
Strategy 2: Bullish/Bearish Divergence (High-Probability Reversals)
Divergence is a powerful signal where the price action contradicts the RSI movement, hinting at an impending trend reversal. This is often a sign that the current trend's momentum is fading, even if price continues its movement.
- Bullish Divergence: This occurs when price makes lower lows, but the RSI makes higher lows. This indicates that despite the price falling, the selling momentum is weakening, signaling a potential upward reversal. The bears are losing their strength.
- Bearish Divergence: This occurs when price makes higher highs, but the RSI makes lower highs. This suggests that despite the price rising, the buying momentum is fading, indicating a potential downward reversal. The bulls are running out of steam.

Important for Intraday Divergence:
- Divergences are generally more reliable on higher timeframes (e.g., daily charts) but can offer sharp intraday moves when spotted correctly on smaller timeframes.
- Confirm with price action, such as a strong bullish engulfing candle or piercing pattern after a bullish divergence, or a bearish engulfing/dark cloud cover after a bearish divergence.
RSI for Swing Trading in Indian Stocks
Swing trading involves holding positions for a few days to a few weeks, capitalizing on short-to-medium term price swings. RSI is excellent for this.
Standard Settings for Swing Trading: The default 14-period RSI is generally preferred for swing trading on daily or even 4-hour charts. The standard 70/30 overbought/oversold levels work well. Some traders might also use 60/40 as "overheated/oversold" zones within a strong trend.
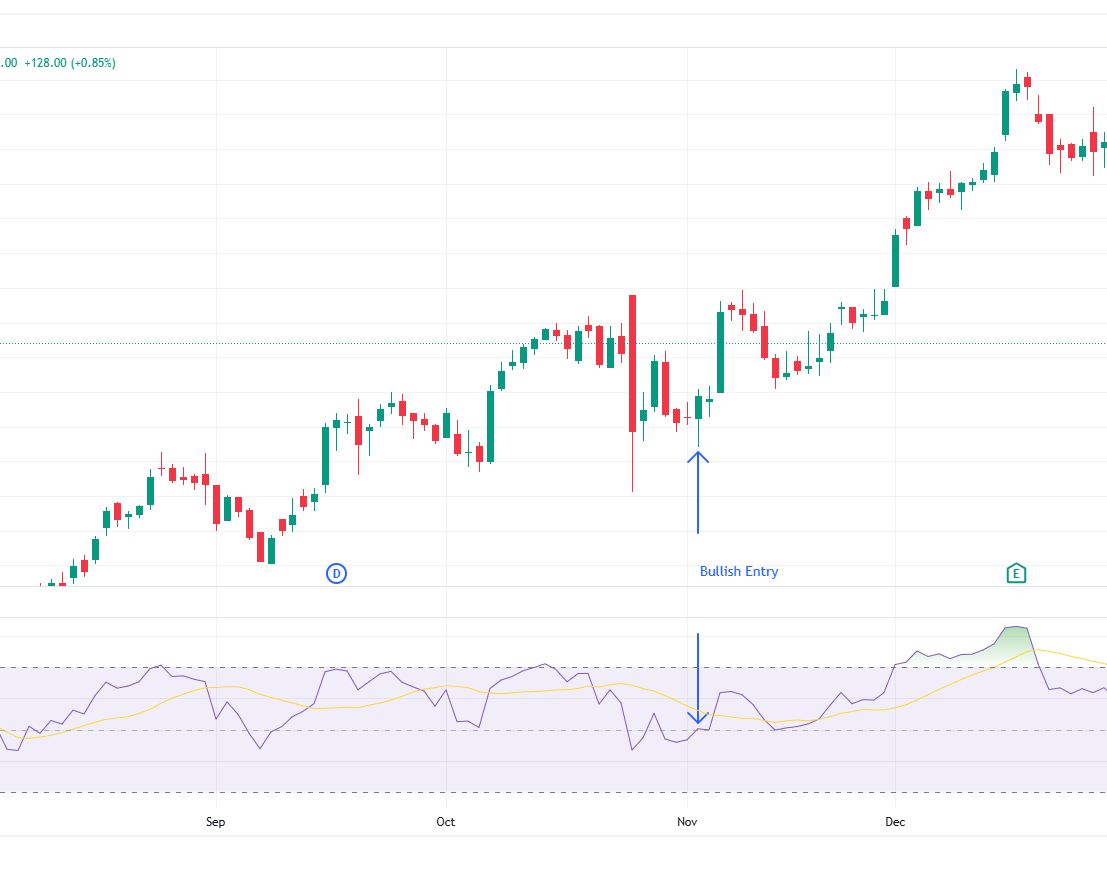
Strategy 1: RSI Pullback within a Trend (RSI Range Shift Concept)
This strategy involves buying dips in an uptrend and selling rallies in a downtrend. It ties closely with the "RSI Range Shift" concept, which describes how the overbought/oversold levels of RSI can shift during strong, sustained trends.
- Understanding RSI Range Shift:
- In a strong uptrend, the RSI often enters a higher trading range, oscillating between 40 and 80 (or even 50 and 90) for extended periods. It rarely dips below the 40-50 level, as buying pressure quickly steps in. When it pulls back to these higher "oversold" zones (e.g., 40-50) and bounces, it's often a signal to buy the dip within the established trend.

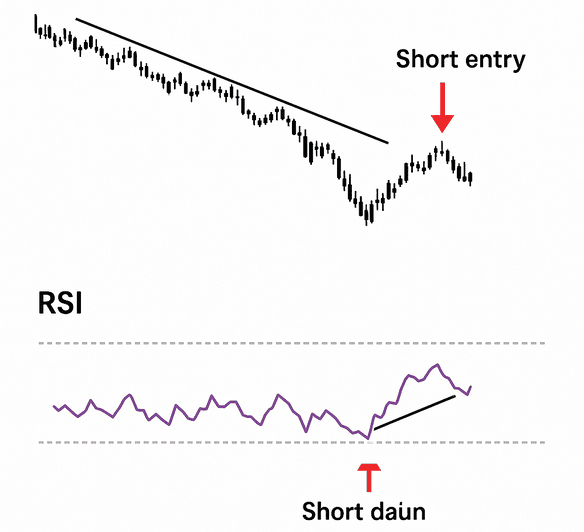
In a strong downtrend, the RSI often enters a lower trading range, oscillating between 20 and 60 (or even 10 and 50) for extended periods. It rarely rises above the 50-60 level, as selling pressure quickly resumes. When it rallies to these lower "overbought" zones (e.g., 50-60) and turns down, it's often a signal to sell the rally or initiate a short position within the downtrend.

- Buy in Uptrend: In a strong uptrend, look for the RSI to pull back to the 40-50 zone (or even 30-40 in very strong trends) and then bounce back upwards. This indicates a healthy correction within an ongoing bull run and can be a good entry point to ride the continuation of the trend.
- Sell in Downtrend: In a strong downtrend, look for the RSI to rally to the 50-60 zone (or even 60-70 in strong downtrends) and then turn downwards. This indicates a retracement within an ongoing bear run and can be a good entry for a short position.
Strategy 2: Failure Swings (Confirming Trend Reversals)
Wilder himself emphasized "failure swings" as high-probability reversal signals. These signals indicate a significant loss of momentum and often precede a larger trend change. They provide a more robust signal than simple overbought/oversold levels.
- Bullish Failure Swing: A strong buy signal. This occurs when:
- RSI drops below 30 (oversold) and then turns up.
- RSI pulls back, but fails to make a new low (it stays above the previous RSI low, typically above 30). This is the "failure" to make a new low.
- RSI then breaks decisively above the peak (swing high) formed during the bounce in step 2. This confirms a bullish reversal in price.
- Bearish Failure Swing: A strong sell signal. This occurs when:
- RSI rises above 70 (overbought) and then turns down.
- RSI bounces, but fails to make a new high (it stays below the previous RSI high, typically below 70). This is the "failure" to make a new high.
- RSI then breaks decisively below the trough (swing low) formed during the fall in step 2. This confirms a bearish reversal in price.
Important for Swing Trading:
- Combine with Support/Resistance: RSI signals are more reliable when they occur near significant support or resistance levels on the price chart. A bullish RSI signal at a strong price support level is a powerful confluence.
- Moving Averages (MAs): Use MAs to confirm the trend. For instance, in an uptrend, ensure the price is above key MAs (e.g., 20-EMA, 50-SMA). This helps filter out false signals against the primary trend.
- Risk Management: Always define your stop-loss and target profit levels before entering a trade. Aim for a favorable risk-reward ratio (e.g., 1:2 or 1:3).
Smart Stock Selection using RSI for Indian Equities
RSI is not just for timing entries; it can be a powerful screener for identifying potential trading candidates.
Technique 1: Scanning for Oversold/Overbought Stocks
Use your broker's scanner or a financial portal to filter stocks based on RSI values.
- For Buy Opportunities: Scan for stocks where RSI is below 30 (or even below 20 for very strong signals). These are potentially undervalued or have seen significant selling pressure and might be due for a bounce.
- For Sell/Short Opportunities: Scan for stocks where RSI is above 70 (or even above 80 for very strong signals). These are potentially overvalued or have seen excessive buying, and might be due for a correction.
Pro-Tip for Indian Market: Filter these results further by:
- Market Cap: Focus on mid-cap or large-cap stocks for better liquidity.
- Volume: Ensure the stock has consistently high trading volume to facilitate easy entry and exit.
- Sector Analysis: Consider the overall sector trend. An oversold stock in a fundamentally weak sector might still continue to fall.
Technique 2: RSI + Volume + Moving Averages for Strength Identification
Combine RSI with other indicators for robust stock selection.
- Identify Uptrend: Look for stocks where the price is consistently trading above key moving averages (e.g., 50-day SMA, 200-day SMA). This confirms a long-term uptrend.
- RSI Pullback: Within this uptrend, look for stocks where the RSI has pulled back to the 40-50 range but has not dipped below 30. This indicates a healthy correction within an ongoing bull run, offering a good entry point.
- Volume Confirmation: Look for a decrease in volume during the RSI pullback (as smart money is not selling off aggressively) and an increase in volume as the RSI starts to turn upwards (indicating renewed buying interest).

Best Practices & Limitations of RSI
While powerful, RSI is not a magic bullet.
Best Practices:
- Always Use with Confirmation: Never rely solely on RSI. Combine it with price action, support/resistance levels, moving averages, and volume analysis.
- Adjust to Market Conditions: In strong bull markets, RSI might stay above 70 for extended periods, indicating strong momentum rather than an immediate reversal. Similarly, in bear markets, it can stay below 30. Adjust your interpretation accordingly. This aligns with the "RSI Range Shift" concept.
- Multi-Timeframe Analysis: Look at RSI on multiple timeframes (e.g., daily and hourly for swing trading) for a more holistic view.
- Risk Management is Paramount: Always define your stop-loss and target profit levels. Protect your capital.
Limitations:
- False Signals: RSI can generate false overbought/oversold signals, especially in highly trending markets if one strictly adheres to 70/30 without considering the range shift.
- Lagging Indicator: As a momentum indicator derived from past prices, it can sometimes lag behind sharp price movements. It's best used to confirm rather than predict in isolation.
- Subjectivity: Interpreting divergences and setting optimal thresholds can be subjective and require practice.
Conclusion: Empower Your Trading with RSI
The Relative Strength Index is a versatile and indispensable tool for any serious trader in the Indian stock market. By understanding its calculation, interpreting its signals (oversold/overbought, divergences, failure swings), and applying it strategically to intraday and swing trading, along with smart stock selection, you can significantly enhance your trading decisions.
Remember, consistent practice, combining RSI with other reliable indicators, and rigorous risk management are the keys to unlocking its full potential. Start integrating RSI into your analysis today and take a step closer to becoming a more confident and profitable trader with Option Matrix India!
Please Note:
- This article is for informational purposes only and does not constitute financial advice. Trading in the stock market involves inherent risks, and you could lose money. Always consult with a qualified financial advisor before making any investment decisions.
- For real-world examples with images, please refer to charting platforms and apply the RSI indicator to live or historical stock charts. You can use screenshots of these charts to illustrate the concepts discussed.
- For web display, ensure this content is easily readable on all devices, with clear headings, short paragraphs, and optimized image sizes. Incorporate relevant keywords like "RSI for Indian market," "intraday trading strategies India," "swing trading RSI," "stock selection India," etc., naturally throughout the text for SEO.