
Bollinger Bands Indicator
Complete Beginner to Advanced Trading Guide
Master the Bollinger Bands Trading Strategy for NSE stocks, Nifty, Bank Nifty and index options—covering volatility, trend continuation, mean reversion, breakouts, risk control and practical chart-reading workflows.
What Is the Bollinger Bands Indicator?
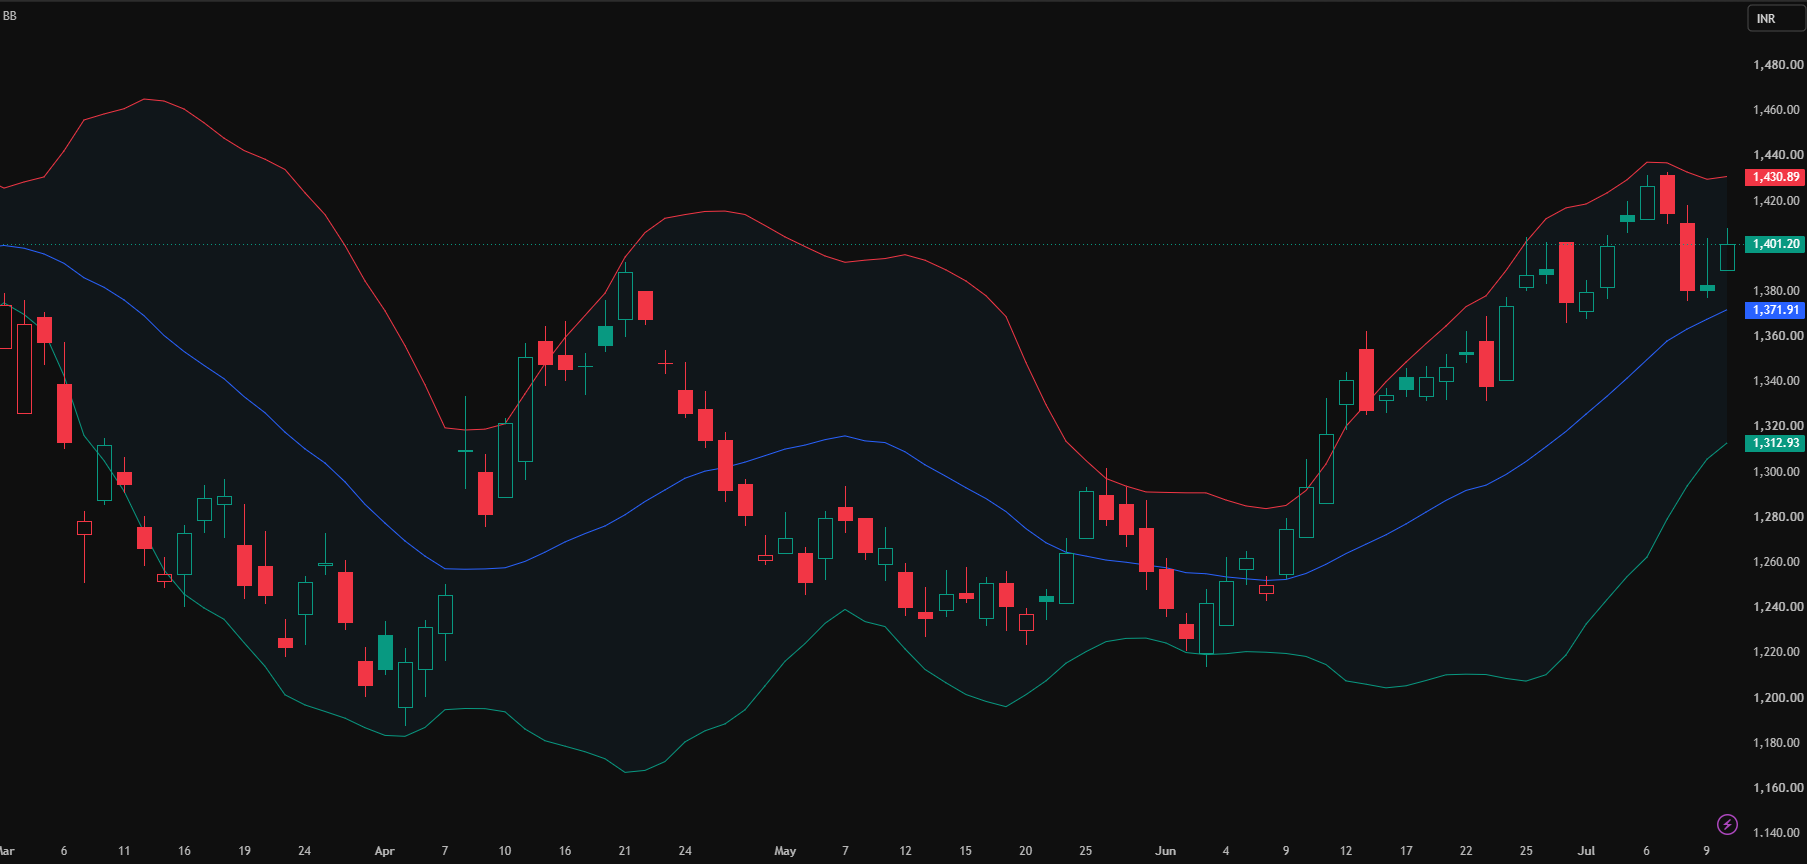
Bollinger Bands is a volatility-based technical indicator that places three dynamic lines around price. The middle line is usually a 20-period simple moving average, while the upper and lower bands sit a selected number of standard deviations above and below that average.
It adapts to volatility
Unlike static support and resistance levels, Bollinger Bands expand when price volatility increases and contract when volatility falls. This gives traders a visual way to judge whether the market is quiet, stretched, accelerating or reverting toward its recent average.
It is not a buy-sell machine
A touch of the upper band does not automatically mean sell, and a touch of the lower band does not automatically mean buy. The most reliable use combines band structure with market trend, price action, volume, timeframe and clear risk rules.
Bollinger Bands measure relative price behaviour, not certainty. Price can remain near an outer band during a strong trend, break outside a band temporarily, or reverse before reaching a band. Context decides whether a signal has trading value.
For Indian traders, the indicator can be applied to NSE-listed stocks, Nifty, Bank Nifty, Sensex-linked instruments, stock futures, index futures, options charts, commodity charts and currency charts. The indicator itself remains the same; the execution plan must change according to liquidity, volatility, lot size, expiry risk and the timeframe being traded.
“Bollinger Bands are best understood as a map of volatility around a moving average—not as a prediction engine.”
Option Matrix India educational frameworkHistory, Creator and Purpose of Bollinger Bands
Bollinger Bands were developed by American financial analyst John Bollinger during the 1980s. They became popular because they made volatility visible in a practical chart format and allowed the bands to respond dynamically to changing market conditions.
The original purpose was not to create a single universal entry signal. It was to provide a relative definition of high and low price by observing where price sits versus its own recent average and volatility range. In practical terms, the bands help answer questions such as: Is price extended? Is volatility compressing? Is a breakout beginning? Is a trend strong enough for a band walk? Or is a range-bound market offering mean-reversion conditions?
Use the indicator as a decision-support layer. First identify market structure—uptrend, downtrend, range, breakout or news-driven volatility. Then use Bollinger Bands to refine location, timing and invalidation.
Bollinger Bands Formula and Calculation
The standard configuration uses a 20-period simple moving average and two standard deviations. Each new candle updates the moving average and standard deviation, so every band changes as the latest data arrives.
Upper Band = SMA(20) + 2 × Standard Deviation(20)
Lower Band = SMA(20) − 2 × Standard Deviation(20)
Middle Band
The middle band is generally the 20-period simple moving average. It acts as a mean, dynamic support/resistance reference, and trend filter.
Upper Band
The upper band is the middle band plus a selected number of standard deviations. It represents a relatively high zone, not an automatic short signal.
Lower Band
The lower band is the middle band minus the selected standard-deviation multiple. It represents a relatively low zone, not an automatic long signal.
Illustrative calculation
Suppose a 20-period average of a Nifty chart is 24,000 and the 20-period standard deviation is 120 points. With the classic 20,2 setting, the upper band is 24,240 and the lower band is 23,760. These values are illustrative only; the actual band values must come from current chart data.
| Component | Illustrative value | Meaning | How traders use it |
|---|---|---|---|
| 20-period SMA | 24,000 | Recent average price | Trend reference, pullback zone, mean target |
| Standard deviation | 120 points | Recent price dispersion | Helps estimate current volatility |
| Upper Band | 24,240 | 24,000 + 2 × 120 | Strength zone, breakout reference, extension area |
| Lower Band | 23,760 | 24,000 − 2 × 120 | Weakness zone, breakdown reference, extension area |
Upper Band, Middle Band, Lower Band and Band Width
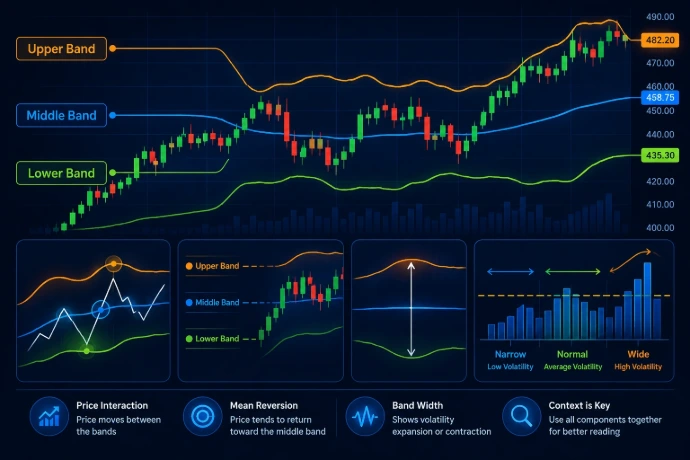
Reading Bollinger Bands properly means studying the relationship among price, the middle band, the outer bands and the width between the bands. One line alone rarely gives the complete story.
Upper band interpretation
When price closes near or above the upper band, assess whether it is a trend expansion or an exhaustion move. Rising middle-band slope, strong candles, higher volume and a sequence of higher highs favour continuation. Rejection wicks, resistance and momentum divergence favour caution.
Lower band interpretation
When price closes near or below the lower band, assess whether sellers are in control or whether a range-bound price is becoming stretched. A falling middle-band slope and repeated lower-band closes can reflect a persistent downtrend.
Middle band interpretation
The 20-period SMA is often the decision line. In an uptrend, a successful pullback and bounce from the middle band can support a continuation setup. In a downtrend, rejection at the middle band can support a sell-on-rise setup.
Band width interpretation
Band width helps reveal contraction and expansion. Narrow bands indicate reduced recent volatility. Wide bands indicate elevated volatility, though a wide-band market may continue trending or may be entering a late-stage emotional move.
Do not judge a band touch in isolation. Read at least four items together: band slope, candle quality, nearby support or resistance, and volume or participation confirmation.
Best Bollinger Bands Settings for NSE Trading
The standard 20-period, 2-standard-deviation configuration is the best starting point for most traders. There is no universally best setting because the ideal parameters depend on timeframe, instrument volatility, strategy style and how entries are confirmed.
| Use case | Suggested setting | Timeframe | Best used for | Important caution |
|---|---|---|---|---|
| Standard | 20, 2 | 15-minute to daily | General NSE stocks, Nifty, Bank Nifty, swing analysis | Use price action; do not trade every outer-band touch |
| Smoother trend | 50, 2 | Hourly to daily | Positional trading and broader trend context | Slower signals; may miss early moves |
| Scalping | 10, 1.5 | 1-minute to 5-minute | Fast intraday mean-reversion setups | Noise is high; strict stop loss is essential |
| Intraday trend | 20, 2 | 5-minute to 15-minute | Pullbacks, trend continuation and range conditions | Avoid blindly trading around major events |
| Options reference | 20, 2 on underlying | 5-minute to 30-minute | Index or stock spot/futures direction before selecting options | Option premium charts add IV and theta distortions |
For Nifty and Bank Nifty, start with 20,2 on the underlying index or liquid futures chart. Use 5-minute or 15-minute charts for intraday structure, 30-minute or hourly charts for broader context, and daily charts for swing or positional decisions.
Bollinger Bands Signals Every Trader Should Know
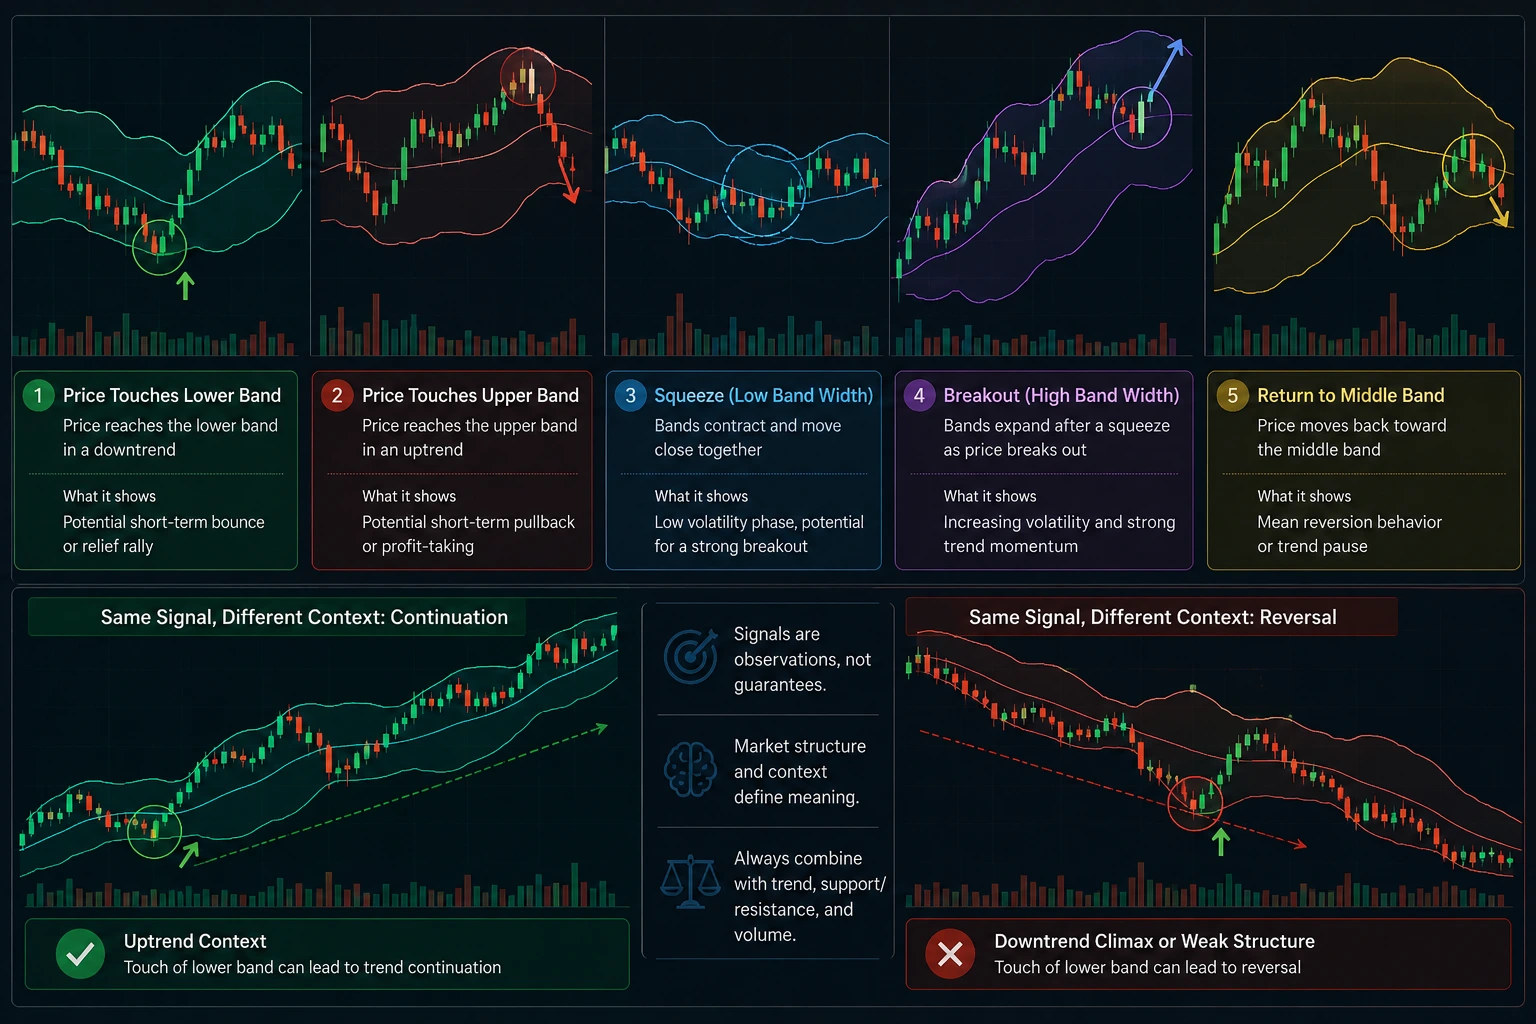
Bollinger Bands generate useful market observations, not guaranteed trades. The same visible event can mean continuation in one market structure and reversal in another.
| Signal | What it means | Confirmation checklist | Primary risk |
|---|---|---|---|
| Band touch | Price reaches an outer volatility boundary | Trend, candle close, support/resistance, volume | Assuming every touch reverses |
| Band walk | Price repeatedly rides one outer band in a strong trend | Rising/falling middle band, strong bodies, shallow pullbacks | Counter-trend trades too early |
| Squeeze | Bands contract as recent volatility decreases | Range boundaries, volume pickup, close outside structure | Predicting direction before price confirms |
| Expansion | Bands widen as volatility increases | Follow-through candles, participation, market structure | Chasing an already extended move |
| Breakout | Price closes beyond a band and key range or level | Close quality, volume, retest or continuation trigger | False breakout in low participation |
| Mean reversion | Price moves from an outer band back toward the middle band | Range market, rejection candle, fading momentum | Fading a strong directional trend |
Bollinger Band squeeze
A squeeze occurs when the upper and lower bands narrow noticeably. It signals low recent volatility, not bullishness or bearishness. Mark the range high and low, wait for a meaningful close and use follow-through or a retest to define direction.
Volatility expansion
Expansion follows a genuine directional move or sudden uncertainty. It can support momentum trades when price breaks structure with strong participation, but late entries after several extended candles can carry poor reward-to-risk.
A candle can pierce an outer band and immediately return inside it. Treat a breakout as higher quality when it closes beyond the range with broad participation, holds the breakout zone or produces a controlled retest rather than a fast rejection.
Bollinger Bands Trading Strategies
The following strategies are educational frameworks. Before using real capital, define exact entry rules, stop placement, target methodology, maximum loss limits, risk per trade and conditions in which you will not trade.
Identify regime
Classify the chart as trending, ranging, compressing or event-driven. Trend strategies and mean-reversion strategies are not interchangeable.
Mark location
Map prior swing highs/lows, day high/low, opening range, VWAP, CPR or key daily levels before reacting to a band event.
Wait for trigger
Use candle close, retest, breakout confirmation, rejection or momentum confirmation. Avoid acting on an unfinished candle.
Plan exit first
Define invalidation, profit target, trailing method and maximum permissible loss before the order is placed.
1. Trend-Following Band Walk Strategy
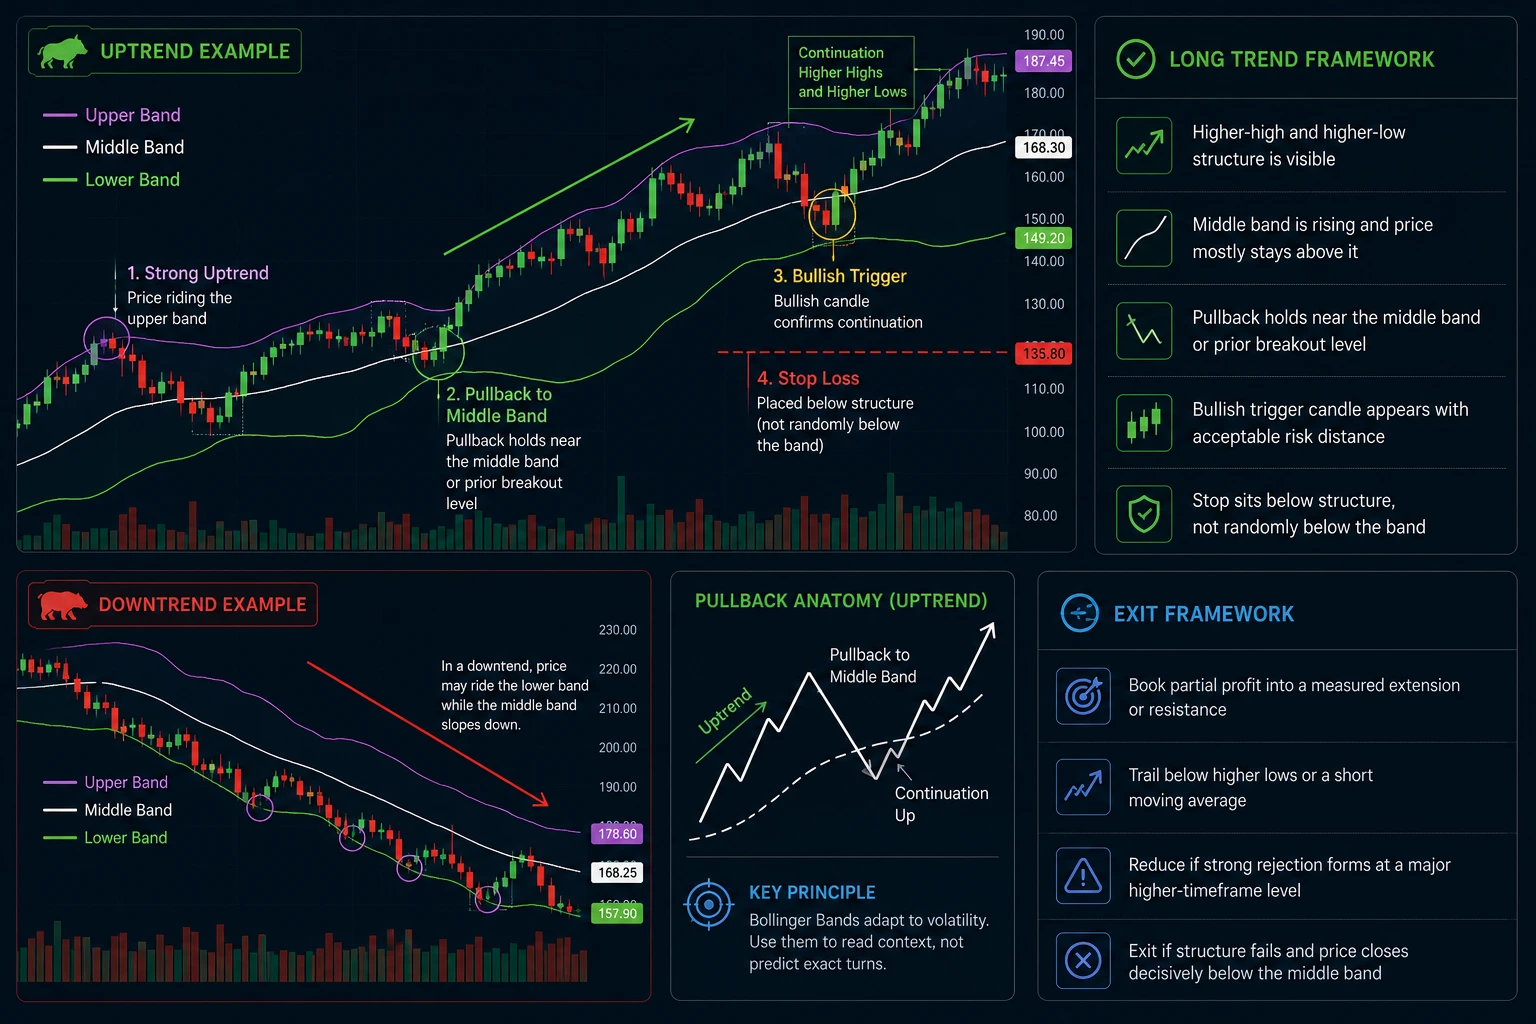
In a strong uptrend, price may repeatedly close near the upper band while the middle band rises. Instead of trying to short every upper-band touch, wait for a pullback toward the middle band or a shallow consolidation, then look for bullish continuation confirmation. In a downtrend, reverse the logic: price may ride the lower band while the middle band slopes down.
Long trend framework
- Higher-high and higher-low structure is visible
- Middle band is rising and price mostly stays above it
- Pullback holds near the middle band or prior breakout level
- Bullish trigger candle appears with acceptable risk distance
- Stop sits below structure, not randomly below the band
Exit framework
- Book partial profit into a measured extension or resistance
- Trail below higher lows or a short moving average
- Reduce if strong rejection forms at a major higher-timeframe level
- Exit if structure fails and price closes decisively below the middle band
2. Bollinger Band Squeeze Breakout Strategy
A squeeze strategy aims to participate after volatility contraction releases into a directional move. The squeeze itself is not an entry. Identify a tight range, draw the range boundaries, wait for price to close outside that structure and assess whether volume, market breadth or sector strength supports the move.
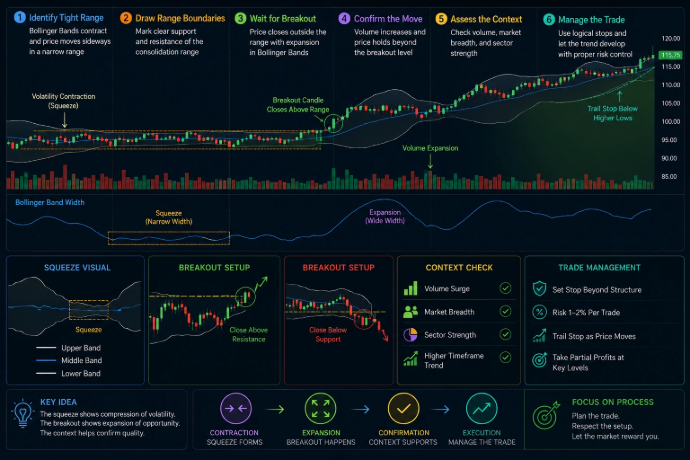
Assume Nifty trades in a narrow intraday range with visibly compressed bands. Instead of buying calls merely because bands are narrow, wait for a close above the range high, review participation and define a stop beneath the breakout or retest low. If price returns inside the range and fails to reclaim it, the breakout thesis is weakened.
3. Mean Reversion Strategy
Mean reversion works best in balanced, range-bound conditions where price oscillates around a relatively flat middle band. A trader may watch for a lower-band test near established support plus a bullish rejection candle, with an initial target around the middle band. The opposite logic applies near the upper band and resistance.
Never use a mean-reversion strategy against a powerful trend simply because price touches an outer band. In a genuine momentum move, the outer band can be walked for several candles and the apparent reversal signal can fail repeatedly.
4. Pullback to Middle Band Strategy
This approach uses the middle band as a dynamic pullback reference in an established trend. In an uptrend, wait for price to retreat toward the rising middle band, a previous breakout level or a moving-average confluence zone. Enter only after price demonstrates renewed buying interest.
5. Intraday Bollinger Bands Strategy
For intraday trading in Nifty, Bank Nifty or highly liquid NSE stocks, combine the 5-minute or 15-minute Bollinger Bands chart with VWAP, opening range, previous day high/low and current-day market context. Avoid taking fresh trades solely because the market has reached an outer band near the opening period.
Bollinger Bands with Other Technical Indicators
Combining indicators should reduce ambiguity, not create a cluttered chart. Choose tools that answer different questions: Bollinger Bands for volatility and location, VWAP for intraday fair-value context, RSI or MACD for momentum, volume for participation and ADX for trend strength.

| Tool | Why combine it | Entry example | Exit / risk logic |
|---|---|---|---|
| RSI | Checks momentum and divergence near outer bands | Range low + lower-band rejection + RSI recovery | Stop beyond range; target middle band then resistance |
| VWAP | Shows intraday value and directional bias | Price above VWAP, rising middle band, pullback hold | Exit on structural VWAP loss or target at day high |
| MACD | Helps evaluate momentum shift and trend continuation | Squeeze breakout with MACD momentum confirmation | Trail until momentum and price structure deteriorate |
| EMA / SMA | Adds short- and long-term trend context | Price above key EMA and middle-band pullback holds | Stop below swing; exit if trend alignment breaks |
| Volume | Tests participation behind breakout or reversal | Range breakout with stronger-than-recent volume | Reduce if breakout loses participation and re-enters range |
| ADX | Helps distinguish trend conditions from range conditions | Band walk with strengthening ADX and trend structure | Avoid mean reversion while trend strength remains strong |
| Supertrend | Provides a simple trailing directional framework | Middle-band bounce aligned with Supertrend direction | Trail based on Supertrend or structure, not emotion |
| CPR | Provides daily reference zones for Indian index trading | Squeeze breakout through CPR with volume and VWAP alignment | Use CPR zone or swing point for invalidation |
| Open Interest / PCR | Adds derivatives positioning context for index options | Directional price setup aligned with changing OI evidence | Do not treat PCR or OI as standalone certainty |
Bollinger Bands in NSE: Nifty, Bank Nifty and Stocks
Bollinger Bands can be applied across Indian market instruments, but each instrument has different liquidity, volatility and event sensitivity. Use the underlying chart as the primary analytical chart when trading options.

Nifty Bollinger Bands
Nifty is appropriate for studying broad market direction. On intraday charts, combine bands with VWAP, opening range, previous day high/low, major option strikes and sector participation. On daily charts, use the middle-band slope and price structure for swing bias.
Bank Nifty Bollinger Bands
Bank Nifty can show sharp expansions because banking stocks contribute heavily to its movement. Reduce size during high-volatility sessions, wait for candle closes, and avoid assuming that the first breakout will always continue.
Reliance, TCS and Infosys
Large-cap stocks can be studied with daily, hourly and 15-minute bands. Combine with stock-specific news, sector trend, results calendar and meaningful delivery or intraday volume context.
HDFC Bank and ICICI Bank
Banking leaders can influence Bank Nifty direction. Compare the individual stock trend with the index structure; divergence among heavyweight stocks can signal a lower-quality index move.
Do not rely on static examples as current trade calls. Use current NSE charts, official exchange information, your broker platform and verified market data to calculate today’s actual bands, levels, volume and derivatives positioning. Every numerical example here is illustrative.
Bollinger Bands for Option Buying and Option Selling
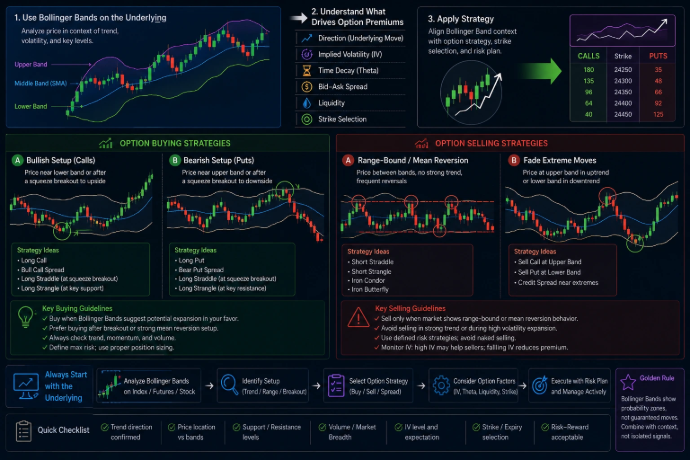
When trading options, use Bollinger Bands first on the underlying index, futures or stock—not only on the option premium chart. The option premium is affected by direction, implied volatility, time decay, spread, liquidity and strike selection.
Option Buying Approach
Option buyers generally need a timely directional move. A squeeze breakout, strong band walk, trend continuation after a middle-band pullback or a decisive range breakout may provide directional context. Choose strikes and expiry with awareness of premium decay and implied volatility.
- Analyse Nifty, Bank Nifty or stock underlying first
- Wait for price confirmation instead of predicting squeeze direction
- Use defined premium risk or underlying-based invalidation
- Respect theta decay, especially near expiry
Option Selling Approach
Option sellers may prefer stable or range-bound conditions, but a narrow Bollinger squeeze can warn that volatility may expand. Selling premium during a squeeze without hedges and risk limits can be dangerous if price breaks out sharply.
- Assess range quality, IV, event risk and margin requirement
- Use defined-risk structures where appropriate
- Avoid unhedged assumptions that outer-band touches will reverse
- Plan adjustment and maximum loss before entry
Expiry Day Considerations
Expiry-day price action can be fast, irregular and highly sensitive to order flow, hedging and time decay. Bollinger Bands may help identify expansion or compression, but the risk of slippage and rapid premium changes rises. Reduce position size, avoid revenge trading and do not convert an intraday derivatives trade into an overnight hope position.
Risk Management for Bollinger Bands Trading
Risk management is more important than finding an indicator signal. A strategy with modest accuracy and controlled losses can be more sustainable than a high-win-rate strategy that occasionally suffers a large unmanaged loss.
| Risk control | Practical rule | Why it matters |
|---|---|---|
| Risk per trade | Decide a small fixed percentage or fixed rupee risk before entry | Prevents one trade from materially damaging capital |
| Position sizing | Size from stop distance and maximum permitted loss | Volatile Bank Nifty trades may need smaller size than quiet stock trades |
| Stop loss | Place beyond structural invalidation, not at an arbitrary band point | Gives the trade logical room while defining when the thesis is wrong |
| Reward-to-risk | Assess expected target versus initial risk before entry | Discourages low-quality chase trades |
| Daily loss limit | Set a maximum daily loss and stop when reached | Protects against emotional overtrading after losses |
Position Size Formula
A simplified approach is:
For derivatives, include lot size, premium movement, spread, margin and possible slippage. The formula is educational and must be adapted to your instrument.
Trading Psychology Checklist
No Bollinger Bands setup removes market risk. Use stop losses, smaller size when volatility expands, diversified decision inputs and a maximum loss limit. If a trade no longer matches the written thesis, exit rather than search for reasons to stay.
20 Common Bollinger Bands Trading Mistakes
Most indicator problems are actually process problems. Traders often misuse Bollinger Bands by ignoring market regime, entering too early, skipping risk management or treating an observation as a certainty.
- Shorting every upper-band touch
- Buying every lower-band touch
- Ignoring a strong band walk in a trend
- Treating a squeeze as a directional prediction
- Entering before the breakout candle closes
- Trading without nearby support/resistance context
- Using the same stop size in every instrument
- Ignoring volume during a breakout
- Ignoring VWAP and session structure for intraday trading
- Using low-liquidity stocks for fast scalping signals
- Changing settings after every losing trade
- Applying options-premium signals without analysing the underlying
- Forgetting implied volatility and theta decay in options
- Trading during major news without a volatility plan
- Chasing a late expansion candle far from logical support
- Ignoring higher-timeframe trend direction
- Averaging down when the band breakout is accelerating
- Taking too many trades in a narrow, noisy range
- Risking too much capital on one perfect setup
- Not keeping a trade journal with screenshots and reasoning
30 Professional Bollinger Bands Trading Tips
Professional use is less about adding complexity and more about repeating disciplined, observable actions. The tips below are designed to improve chart context, execution quality and risk control.
Context Tips
- Start with the higher timeframe before entering on a lower timeframe.
- Check whether the middle band is rising, falling or flat.
- Mark daily support and resistance before using intraday bands.
- Separate trend days from range days.
- Use band width to identify contraction and expansion phases.
- Watch how price closes, not merely where it wicks.
- Compare index behaviour with key heavyweight stocks.
- Track scheduled events that can distort volatility.
- Use current data; do not make decisions from stale screenshots.
- Remember that bands describe recent behaviour, not future certainty.
Execution Tips
- Wait for a trigger candle after a pullback to the middle band.
- Use breakout-retest entries when direct breakouts are too extended.
- Require volume or participation confirmation for important breaks.
- Do not chase after multiple expansion candles.
- Use limit orders carefully where spreads are meaningful.
- Keep your entry criteria the same across samples for valid testing.
- Trade only instruments with adequate liquidity for your size.
- Use the underlying chart first when trading options.
- Keep scalping and swing-trading rules separate.
- Skip setups where the stop distance makes position size impractical.
Risk and Review Tips
- Risk a predefined amount, not an emotional amount.
- Place stops where the market thesis is invalidated.
- Take partial profits only if it fits your tested methodology.
- Do not widen a stop merely to avoid a loss.
- Set a daily maximum loss before the session starts.
- Reduce size during unusually wide bands or major events.
- Journal setup type, timeframe, result and execution quality.
- Review whether losses came from setup failure or rule failure.
- Backtest manually across multiple market conditions.
- Protect capital first; opportunity returns every trading day.
Advantages and Disadvantages of Bollinger Bands
Bollinger Bands are popular because they are simple to display and versatile across markets. Their limitations matter equally: they are reactive, can generate ambiguous signals and require context from trend, structure and risk management.
| Advantages | Why it helps | Limitations | How to manage the limitation |
|---|---|---|---|
| Adapts to volatility | Bands widen and narrow with recent price dispersion | Reactive to past price movement | Use market structure and confirmation, not prediction alone |
| Works across timeframes | Applicable from intraday to positional charts | Lower timeframes contain more noise | Use higher-timeframe alignment and strict risk limits |
| Easy visual interpretation | Shows price location around a dynamic average | Can encourage simplistic touch-based trades | Distinguish trend continuation from mean reversion |
| Useful for squeeze detection | Highlights volatility contraction before potential expansion | Does not forecast breakout direction | Wait for breakout confirmation and follow-through |
| Supports multiple strategies | Can assist trend, pullback, breakout and range methods | One rule does not suit every regime | Use separate rule sets for trend and range conditions |
Bollinger Bands Indicator FAQs
These FAQs are structured for readers and can be adapted into FAQPage schema by your CMS or SEO implementation workflow.
What is Bollinger Bands Indicator?
What are the best Bollinger Bands settings?
Is Bollinger Bands good for intraday trading?
Can I use Bollinger Bands for Nifty?
Can I use Bollinger Bands for Bank Nifty?
Does touching the upper Bollinger Band mean sell?
Does touching the lower Bollinger Band mean buy?
What is a Bollinger Bands squeeze?
How do I trade a Bollinger Bands breakout?
What is a band walk?
Can Bollinger Bands predict price?
What is the middle band in Bollinger Bands?
Which timeframe is best for Bollinger Bands?
Can Bollinger Bands be used for swing trading?
Can Bollinger Bands be used for scalping?
Should I use Bollinger Bands with RSI?
Should I use Bollinger Bands with VWAP?
How do Bollinger Bands help option buyers?
How do Bollinger Bands help option sellers?
Are Bollinger Bands useful on expiry day?
What causes false Bollinger Band breakouts?
How can I avoid false breakouts?
Do Bollinger Bands work on stocks such as Reliance or TCS?
What does wide Bollinger Bands mean?
What does narrow Bollinger Bands mean?
Can Bollinger Bands replace support and resistance?
What is better: Bollinger Bands or Supertrend?
What is better: Bollinger Bands or MACD?
How should beginners start using Bollinger Bands?
Is Bollinger Bands enough for profitable trading?
Bollinger Bands: Use Volatility With Context
Bollinger Bands Indicator is a powerful visual framework for understanding relative price location and changing volatility. The upper and lower bands help identify extension and momentum, the middle band helps organise trend and pullback analysis, and band width helps identify contraction and expansion.
For NSE traders, the highest-quality use comes from combining Bollinger Bands with price action, support and resistance, volume, VWAP, higher-timeframe structure and disciplined risk management. Whether you trade Nifty, Bank Nifty, Reliance, TCS, Infosys, HDFC Bank, ICICI Bank, futures or options, treat every band signal as a scenario to validate—not a guaranteed forecast.
Continue Learning on Option Matrix India
All examples are educational and illustrative. They are not live prices, recommendations or trade calls. Financial markets, futures and options involve risk of loss. Consult a SEBI-registered investment adviser where appropriate and trade only with capital you can afford to risk.
Bollinger Bands Indicator
Complete Beginner to Advanced Trading Guide
Master the Bollinger Bands Trading Strategy for NSE stocks, Nifty, Bank Nifty and index options—covering volatility, trend continuation, mean reversion, breakouts, risk control and practical chart-reading workflows.
What Is the Bollinger Bands Indicator?
Bollinger Bands is a volatility-based technical indicator that places three dynamic lines around price. The middle line is usually a 20-period simple moving average, while the upper and lower bands sit a selected number of standard deviations above and below that average.
It adapts to volatility
Unlike static support and resistance levels, Bollinger Bands expand when price volatility increases and contract when volatility falls. This gives traders a visual way to judge whether the market is quiet, stretched, accelerating or reverting toward its recent average.
It is not a buy-sell machine
A touch of the upper band does not automatically mean sell, and a touch of the lower band does not automatically mean buy. The most reliable use combines band structure with market trend, price action, volume, timeframe and clear risk rules.
Bollinger Bands measure relative price behaviour, not certainty. Price can remain near an outer band during a strong trend, break outside a band temporarily, or reverse before reaching a band. Context decides whether a signal has trading value.
For Indian traders, the indicator can be applied to NSE-listed stocks, Nifty, Bank Nifty, Sensex-linked instruments, stock futures, index futures, options charts, commodity charts and currency charts. The indicator itself remains the same; the execution plan must change according to liquidity, volatility, lot size, expiry risk and the timeframe being traded.
“Bollinger Bands are best understood as a map of volatility around a moving average—not as a prediction engine.”
Option Matrix India educational frameworkHistory, Creator and Purpose of Bollinger Bands
Bollinger Bands were developed by American financial analyst John Bollinger during the 1980s. They became popular because they made volatility visible in a practical chart format and allowed the bands to respond dynamically to changing market conditions.
The original purpose was not to create a single universal entry signal. It was to provide a relative definition of high and low price by observing where price sits versus its own recent average and volatility range. In practical terms, the bands help answer questions such as: Is price extended? Is volatility compressing? Is a breakout beginning? Is a trend strong enough for a band walk? Or is a range-bound market offering mean-reversion conditions?
Use the indicator as a decision-support layer. First identify market structure—uptrend, downtrend, range, breakout or news-driven volatility. Then use Bollinger Bands to refine location, timing and invalidation.
Bollinger Bands Formula and Calculation
The standard configuration uses a 20-period simple moving average and two standard deviations. Each new candle updates the moving average and standard deviation, so every band changes as the latest data arrives.
Upper Band = SMA(20) + 2 × Standard Deviation(20)
Lower Band = SMA(20) − 2 × Standard Deviation(20)
Middle Band
The middle band is generally the 20-period simple moving average. It acts as a mean, dynamic support/resistance reference, and trend filter.
Upper Band
The upper band is the middle band plus a selected number of standard deviations. It represents a relatively high zone, not an automatic short signal.
Lower Band
The lower band is the middle band minus the selected standard-deviation multiple. It represents a relatively low zone, not an automatic long signal.
Illustrative calculation
Suppose a 20-period average of a Nifty chart is 24,000 and the 20-period standard deviation is 120 points. With the classic 20,2 setting, the upper band is 24,240 and the lower band is 23,760. These values are illustrative only; the actual band values must come from current chart data.
| Component | Illustrative value | Meaning | How traders use it |
|---|---|---|---|
| 20-period SMA | 24,000 | Recent average price | Trend reference, pullback zone, mean target |
| Standard deviation | 120 points | Recent price dispersion | Helps estimate current volatility |
| Upper Band | 24,240 | 24,000 + 2 × 120 | Strength zone, breakout reference, extension area |
| Lower Band | 23,760 | 24,000 − 2 × 120 | Weakness zone, breakdown reference, extension area |
Upper Band, Middle Band, Lower Band and Band Width
Reading Bollinger Bands properly means studying the relationship among price, the middle band, the outer bands and the width between the bands. One line alone rarely gives the complete story.
Upper band interpretation
When price closes near or above the upper band, assess whether it is a trend expansion or an exhaustion move. Rising middle-band slope, strong candles, higher volume and a sequence of higher highs favour continuation. Rejection wicks, resistance and momentum divergence favour caution.
Lower band interpretation
When price closes near or below the lower band, assess whether sellers are in control or whether a range-bound price is becoming stretched. A falling middle-band slope and repeated lower-band closes can reflect a persistent downtrend.
Middle band interpretation
The 20-period SMA is often the decision line. In an uptrend, a successful pullback and bounce from the middle band can support a continuation setup. In a downtrend, rejection at the middle band can support a sell-on-rise setup.
Band width interpretation
Band width helps reveal contraction and expansion. Narrow bands indicate reduced recent volatility. Wide bands indicate elevated volatility, though a wide-band market may continue trending or may be entering a late-stage emotional move.
Do not judge a band touch in isolation. Read at least four items together: band slope, candle quality, nearby support or resistance, and volume or participation confirmation.
Best Bollinger Bands Settings for NSE Trading
The standard 20-period, 2-standard-deviation configuration is the best starting point for most traders. There is no universally best setting because the ideal parameters depend on timeframe, instrument volatility, strategy style and how entries are confirmed.
| Use case | Suggested setting | Timeframe | Best used for | Important caution |
|---|---|---|---|---|
| Standard | 20, 2 | 15-minute to daily | General NSE stocks, Nifty, Bank Nifty, swing analysis | Use price action; do not trade every outer-band touch |
| Smoother trend | 50, 2 | Hourly to daily | Positional trading and broader trend context | Slower signals; may miss early moves |
| Scalping | 10, 1.5 | 1-minute to 5-minute | Fast intraday mean-reversion setups | Noise is high; strict stop loss is essential |
| Intraday trend | 20, 2 | 5-minute to 15-minute | Pullbacks, trend continuation and range conditions | Avoid blindly trading around major events |
| Options reference | 20, 2 on underlying | 5-minute to 30-minute | Index or stock spot/futures direction before selecting options | Option premium charts add IV and theta distortions |
For Nifty and Bank Nifty, start with 20,2 on the underlying index or liquid futures chart. Use 5-minute or 15-minute charts for intraday structure, 30-minute or hourly charts for broader context, and daily charts for swing or positional decisions.
Bollinger Bands Signals Every Trader Should Know
Bollinger Bands generate useful market observations, not guaranteed trades. The same visible event can mean continuation in one market structure and reversal in another.
| Signal | What it means | Confirmation checklist | Primary risk |
|---|---|---|---|
| Band touch | Price reaches an outer volatility boundary | Trend, candle close, support/resistance, volume | Assuming every touch reverses |
| Band walk | Price repeatedly rides one outer band in a strong trend | Rising/falling middle band, strong bodies, shallow pullbacks | Counter-trend trades too early |
| Squeeze | Bands contract as recent volatility decreases | Range boundaries, volume pickup, close outside structure | Predicting direction before price confirms |
| Expansion | Bands widen as volatility increases | Follow-through candles, participation, market structure | Chasing an already extended move |
| Breakout | Price closes beyond a band and key range or level | Close quality, volume, retest or continuation trigger | False breakout in low participation |
| Mean reversion | Price moves from an outer band back toward the middle band | Range market, rejection candle, fading momentum | Fading a strong directional trend |
Bollinger Band squeeze
A squeeze occurs when the upper and lower bands narrow noticeably. It signals low recent volatility, not bullishness or bearishness. Mark the range high and low, wait for a meaningful close and use follow-through or a retest to define direction.
Volatility expansion
Expansion follows a genuine directional move or sudden uncertainty. It can support momentum trades when price breaks structure with strong participation, but late entries after several extended candles can carry poor reward-to-risk.
A candle can pierce an outer band and immediately return inside it. Treat a breakout as higher quality when it closes beyond the range with broad participation, holds the breakout zone or produces a controlled retest rather than a fast rejection.
Bollinger Bands Trading Strategies
The following strategies are educational frameworks. Before using real capital, define exact entry rules, stop placement, target methodology, maximum loss limits, risk per trade and conditions in which you will not trade.
Identify regime
Classify the chart as trending, ranging, compressing or event-driven. Trend strategies and mean-reversion strategies are not interchangeable.
Mark location
Map prior swing highs/lows, day high/low, opening range, VWAP, CPR or key daily levels before reacting to a band event.
Wait for trigger
Use candle close, retest, breakout confirmation, rejection or momentum confirmation. Avoid acting on an unfinished candle.
Plan exit first
Define invalidation, profit target, trailing method and maximum permissible loss before the order is placed.
1. Trend-Following Band Walk Strategy
In a strong uptrend, price may repeatedly close near the upper band while the middle band rises. Instead of trying to short every upper-band touch, wait for a pullback toward the middle band or a shallow consolidation, then look for bullish continuation confirmation. In a downtrend, reverse the logic: price may ride the lower band while the middle band slopes down.
Long trend framework
- Higher-high and higher-low structure is visible
- Middle band is rising and price mostly stays above it
- Pullback holds near the middle band or prior breakout level
- Bullish trigger candle appears with acceptable risk distance
- Stop sits below structure, not randomly below the band
Exit framework
- Book partial profit into a measured extension or resistance
- Trail below higher lows or a short moving average
- Reduce if strong rejection forms at a major higher-timeframe level
- Exit if structure fails and price closes decisively below the middle band
2. Bollinger Band Squeeze Breakout Strategy
A squeeze strategy aims to participate after volatility contraction releases into a directional move. The squeeze itself is not an entry. Identify a tight range, draw the range boundaries, wait for price to close outside that structure and assess whether volume, market breadth or sector strength supports the move.
Assume Nifty trades in a narrow intraday range with visibly compressed bands. Instead of buying calls merely because bands are narrow, wait for a close above the range high, review participation and define a stop beneath the breakout or retest low. If price returns inside the range and fails to reclaim it, the breakout thesis is weakened.
3. Mean Reversion Strategy
Mean reversion works best in balanced, range-bound conditions where price oscillates around a relatively flat middle band. A trader may watch for a lower-band test near established support plus a bullish rejection candle, with an initial target around the middle band. The opposite logic applies near the upper band and resistance.
Never use a mean-reversion strategy against a powerful trend simply because price touches an outer band. In a genuine momentum move, the outer band can be walked for several candles and the apparent reversal signal can fail repeatedly.
4. Pullback to Middle Band Strategy
This approach uses the middle band as a dynamic pullback reference in an established trend. In an uptrend, wait for price to retreat toward the rising middle band, a previous breakout level or a moving-average confluence zone. Enter only after price demonstrates renewed buying interest.
5. Intraday Bollinger Bands Strategy
For intraday trading in Nifty, Bank Nifty or highly liquid NSE stocks, combine the 5-minute or 15-minute Bollinger Bands chart with VWAP, opening range, previous day high/low and current-day market context. Avoid taking fresh trades solely because the market has reached an outer band near the opening period.
Bollinger Bands with Other Technical Indicators
Combining indicators should reduce ambiguity, not create a cluttered chart. Choose tools that answer different questions: Bollinger Bands for volatility and location, VWAP for intraday fair-value context, RSI or MACD for momentum, volume for participation and ADX for trend strength.
| Tool | Why combine it | Entry example | Exit / risk logic |
|---|---|---|---|
| RSI | Checks momentum and divergence near outer bands | Range low + lower-band rejection + RSI recovery | Stop beyond range; target middle band then resistance |
| VWAP | Shows intraday value and directional bias | Price above VWAP, rising middle band, pullback hold | Exit on structural VWAP loss or target at day high |
| MACD | Helps evaluate momentum shift and trend continuation | Squeeze breakout with MACD momentum confirmation | Trail until momentum and price structure deteriorate |
| EMA / SMA | Adds short- and long-term trend context | Price above key EMA and middle-band pullback holds | Stop below swing; exit if trend alignment breaks |
| Volume | Tests participation behind breakout or reversal | Range breakout with stronger-than-recent volume | Reduce if breakout loses participation and re-enters range |
| ADX | Helps distinguish trend conditions from range conditions | Band walk with strengthening ADX and trend structure | Avoid mean reversion while trend strength remains strong |
| Supertrend | Provides a simple trailing directional framework | Middle-band bounce aligned with Supertrend direction | Trail based on Supertrend or structure, not emotion |
| CPR | Provides daily reference zones for Indian index trading | Squeeze breakout through CPR with volume and VWAP alignment | Use CPR zone or swing point for invalidation |
| Open Interest / PCR | Adds derivatives positioning context for index options | Directional price setup aligned with changing OI evidence | Do not treat PCR or OI as standalone certainty |
Bollinger Bands in NSE: Nifty, Bank Nifty and Stocks
Bollinger Bands can be applied across Indian market instruments, but each instrument has different liquidity, volatility and event sensitivity. Use the underlying chart as the primary analytical chart when trading options.
Nifty Bollinger Bands
Nifty is appropriate for studying broad market direction. On intraday charts, combine bands with VWAP, opening range, previous day high/low, major option strikes and sector participation. On daily charts, use the middle-band slope and price structure for swing bias.
Bank Nifty Bollinger Bands
Bank Nifty can show sharp expansions because banking stocks contribute heavily to its movement. Reduce size during high-volatility sessions, wait for candle closes, and avoid assuming that the first breakout will always continue.
Reliance, TCS and Infosys
Large-cap stocks can be studied with daily, hourly and 15-minute bands. Combine with stock-specific news, sector trend, results calendar and meaningful delivery or intraday volume context.
HDFC Bank and ICICI Bank
Banking leaders can influence Bank Nifty direction. Compare the individual stock trend with the index structure; divergence among heavyweight stocks can signal a lower-quality index move.
Do not rely on static examples as current trade calls. Use current NSE charts, official exchange information, your broker platform and verified market data to calculate today’s actual bands, levels, volume and derivatives positioning. Every numerical example here is illustrative.
Bollinger Bands for Option Buying and Option Selling
When trading options, use Bollinger Bands first on the underlying index, futures or stock—not only on the option premium chart. The option premium is affected by direction, implied volatility, time decay, spread, liquidity and strike selection.
Option Buying Approach
Option buyers generally need a timely directional move. A squeeze breakout, strong band walk, trend continuation after a middle-band pullback or a decisive range breakout may provide directional context. Choose strikes and expiry with awareness of premium decay and implied volatility.
- Analyse Nifty, Bank Nifty or stock underlying first
- Wait for price confirmation instead of predicting squeeze direction
- Use defined premium risk or underlying-based invalidation
- Respect theta decay, especially near expiry
Option Selling Approach
Option sellers may prefer stable or range-bound conditions, but a narrow Bollinger squeeze can warn that volatility may expand. Selling premium during a squeeze without hedges and risk limits can be dangerous if price breaks out sharply.
- Assess range quality, IV, event risk and margin requirement
- Use defined-risk structures where appropriate
- Avoid unhedged assumptions that outer-band touches will reverse
- Plan adjustment and maximum loss before entry
Expiry Day Considerations
Expiry-day price action can be fast, irregular and highly sensitive to order flow, hedging and time decay. Bollinger Bands may help identify expansion or compression, but the risk of slippage and rapid premium changes rises. Reduce position size, avoid revenge trading and do not convert an intraday derivatives trade into an overnight hope position.
Risk Management for Bollinger Bands Trading
Risk management is more important than finding an indicator signal. A strategy with modest accuracy and controlled losses can be more sustainable than a high-win-rate strategy that occasionally suffers a large unmanaged loss.
| Risk control | Practical rule | Why it matters |
|---|---|---|
| Risk per trade | Decide a small fixed percentage or fixed rupee risk before entry | Prevents one trade from materially damaging capital |
| Position sizing | Size from stop distance and maximum permitted loss | Volatile Bank Nifty trades may need smaller size than quiet stock trades |
| Stop loss | Place beyond structural invalidation, not at an arbitrary band point | Gives the trade logical room while defining when the thesis is wrong |
| Reward-to-risk | Assess expected target versus initial risk before entry | Discourages low-quality chase trades |
| Daily loss limit | Set a maximum daily loss and stop when reached | Protects against emotional overtrading after losses |
Position Size Formula
A simplified approach is:
For derivatives, include lot size, premium movement, spread, margin and possible slippage. The formula is educational and must be adapted to your instrument.
Trading Psychology Checklist
No Bollinger Bands setup removes market risk. Use stop losses, smaller size when volatility expands, diversified decision inputs and a maximum loss limit. If a trade no longer matches the written thesis, exit rather than search for reasons to stay.
20 Common Bollinger Bands Trading Mistakes
Most indicator problems are actually process problems. Traders often misuse Bollinger Bands by ignoring market regime, entering too early, skipping risk management or treating an observation as a certainty.
- Shorting every upper-band touch
- Buying every lower-band touch
- Ignoring a strong band walk in a trend
- Treating a squeeze as a directional prediction
- Entering before the breakout candle closes
- Trading without nearby support/resistance context
- Using the same stop size in every instrument
- Ignoring volume during a breakout
- Ignoring VWAP and session structure for intraday trading
- Using low-liquidity stocks for fast scalping signals
- Changing settings after every losing trade
- Applying options-premium signals without analysing the underlying
- Forgetting implied volatility and theta decay in options
- Trading during major news without a volatility plan
- Chasing a late expansion candle far from logical support
- Ignoring higher-timeframe trend direction
- Averaging down when the band breakout is accelerating
- Taking too many trades in a narrow, noisy range
- Risking too much capital on one perfect setup
- Not keeping a trade journal with screenshots and reasoning
30 Professional Bollinger Bands Trading Tips
Professional use is less about adding complexity and more about repeating disciplined, observable actions. The tips below are designed to improve chart context, execution quality and risk control.
Context Tips
- Start with the higher timeframe before entering on a lower timeframe.
- Check whether the middle band is rising, falling or flat.
- Mark daily support and resistance before using intraday bands.
- Separate trend days from range days.
- Use band width to identify contraction and expansion phases.
- Watch how price closes, not merely where it wicks.
- Compare index behaviour with key heavyweight stocks.
- Track scheduled events that can distort volatility.
- Use current data; do not make decisions from stale screenshots.
- Remember that bands describe recent behaviour, not future certainty.
Execution Tips
- Wait for a trigger candle after a pullback to the middle band.
- Use breakout-retest entries when direct breakouts are too extended.
- Require volume or participation confirmation for important breaks.
- Do not chase after multiple expansion candles.
- Use limit orders carefully where spreads are meaningful.
- Keep your entry criteria the same across samples for valid testing.
- Trade only instruments with adequate liquidity for your size.
- Use the underlying chart first when trading options.
- Keep scalping and swing-trading rules separate.
- Skip setups where the stop distance makes position size impractical.
Risk and Review Tips
- Risk a predefined amount, not an emotional amount.
- Place stops where the market thesis is invalidated.
- Take partial profits only if it fits your tested methodology.
- Do not widen a stop merely to avoid a loss.
- Set a daily maximum loss before the session starts.
- Reduce size during unusually wide bands or major events.
- Journal setup type, timeframe, result and execution quality.
- Review whether losses came from setup failure or rule failure.
- Backtest manually across multiple market conditions.
- Protect capital first; opportunity returns every trading day.
Advantages and Disadvantages of Bollinger Bands
Bollinger Bands are popular because they are simple to display and versatile across markets. Their limitations matter equally: they are reactive, can generate ambiguous signals and require context from trend, structure and risk management.
| Advantages | Why it helps | Limitations | How to manage the limitation |
|---|---|---|---|
| Adapts to volatility | Bands widen and narrow with recent price dispersion | Reactive to past price movement | Use market structure and confirmation, not prediction alone |
| Works across timeframes | Applicable from intraday to positional charts | Lower timeframes contain more noise | Use higher-timeframe alignment and strict risk limits |
| Easy visual interpretation | Shows price location around a dynamic average | Can encourage simplistic touch-based trades | Distinguish trend continuation from mean reversion |
| Useful for squeeze detection | Highlights volatility contraction before potential expansion | Does not forecast breakout direction | Wait for breakout confirmation and follow-through |
| Supports multiple strategies | Can assist trend, pullback, breakout and range methods | One rule does not suit every regime | Use separate rule sets for trend and range conditions |
Bollinger Bands Indicator FAQs
These FAQs are structured for readers and can be adapted into FAQPage schema by your CMS or SEO implementation workflow.
What is Bollinger Bands Indicator?
What are the best Bollinger Bands settings?
Is Bollinger Bands good for intraday trading?
Can I use Bollinger Bands for Nifty?
Can I use Bollinger Bands for Bank Nifty?
Does touching the upper Bollinger Band mean sell?
Does touching the lower Bollinger Band mean buy?
What is a Bollinger Bands squeeze?
How do I trade a Bollinger Bands breakout?
What is a band walk?
Can Bollinger Bands predict price?
What is the middle band in Bollinger Bands?
Which timeframe is best for Bollinger Bands?
Can Bollinger Bands be used for swing trading?
Can Bollinger Bands be used for scalping?
Should I use Bollinger Bands with RSI?
Should I use Bollinger Bands with VWAP?
How do Bollinger Bands help option buyers?
How do Bollinger Bands help option sellers?
Are Bollinger Bands useful on expiry day?
What causes false Bollinger Band breakouts?
How can I avoid false breakouts?
Do Bollinger Bands work on stocks such as Reliance or TCS?
What does wide Bollinger Bands mean?
What does narrow Bollinger Bands mean?
Can Bollinger Bands replace support and resistance?
What is better: Bollinger Bands or Supertrend?
What is better: Bollinger Bands or MACD?
How should beginners start using Bollinger Bands?
Is Bollinger Bands enough for profitable trading?
Bollinger Bands: Use Volatility With Context
Bollinger Bands Indicator is a powerful visual framework for understanding relative price location and changing volatility. The upper and lower bands help identify extension and momentum, the middle band helps organise trend and pullback analysis, and band width helps identify contraction and expansion.
For NSE traders, the highest-quality use comes from combining Bollinger Bands with price action, support and resistance, volume, VWAP, higher-timeframe structure and disciplined risk management. Whether you trade Nifty, Bank Nifty, Reliance, TCS, Infosys, HDFC Bank, ICICI Bank, futures or options, treat every band signal as a scenario to validate—not a guaranteed forecast.
Continue Learning on Option Matrix India
All examples are educational and illustrative. They are not live prices, recommendations or trade calls. Financial markets, futures and options involve risk of loss. Consult a SEBI-registered investment adviser where appropriate and trade only with capital you can afford to risk.