Technical Analysis for 26th Nov 2025
Nifty Predictions, Bank Nifty Predictions & Sensex Predictions
SEO Meta Description: Daily Technical Analysis for the Indian Stock Market. Get accurate Nifty Predictions, Bank Nifty Predictions & Sensex Predictions with support and resistance levels, daily candle analysis, and tomorrow's market prediction for November 26, 2025. Complete guide with 9 DMA and 20 DMA analysis.
Introduction
The Indian Stock Market witnessed a subdued monthly expiry session on November 25, 2025, with all major indices closing in the red. The Nifty 50 0.29% closed at 25,884.80, down by 74.70 points, while Bank Nifty settled at 58,882, and the BSE Sensex 0.37% ended at 84,587.01, losing 313.70 points. The market remained range-bound throughout the day with late-session selling pressure dragging indices lower. This Technical Analysis for 26th Nov 2025 provides detailed predictions and key trading levels for tomorrow's session.
The monthly expiry session reflected typical expiry-related volatility, with the market maker ensuring minimal profit opportunities for retail traders. Despite gap-up openings across all indices, sustained buying pressure failed to materialize, and the markets ended near the day's lows.
Key Observations of Today's Derivative Market Data
Nifty 50 – November 25, 2025
- Open: 25,998.50
- High: 26,032.60
- Low: 25,857.50
- Close: 25,884.80
- Change: -74.70 points
Candle Pattern: Bearish engulfing pattern with a long upper shadow indicating selling pressure at higher levels. The index tested the 26,000 psychological level multiple times but failed to sustain above it. The 9 DMA at 25,950 acted as a strong resistance throughout the session.
Bank Nifty – November 25, 2025
- Open: Gap-up opening
- High: Near 59,125
- Low: 58,746
- Close: 58,882
Candle Pattern: Doji-like pattern with indecision. Bank Nifty remained above the 9 DMA (58,788) for most of the session but failed to break the 59,000 resistance zone. The index showed relative strength compared to Nifty 50, bouncing multiple times from the 9 DMA support.
BSE Sensex – November 25, 2025
- Open: 85,008.93
- High: 85,110.24
- Low: 84,536.73
- Close: 84,587.01
- Change: -313.70 points
Candle Pattern: Bearish candle with lower close, breaking multiple support levels in the last hour of trading. The index tested the 85,000 level but faced rejection, eventually closing below all key support zones.
Support & Resistance Levels
Nifty 50 Key Levels
Support Levels:
- 25,857 – Today's low (critical support)
- 25,836 – Minor support
- 25,798 – Strong support zone
- 25,757 – Extended downside target
Resistance Levels:
- 25,912 – Immediate resistance
- 25,950 – 9 DMA (key resistance)
- 26,000 – Psychological level
- 26,052 – Major resistance
- 26,100 – Upside target
Moving Averages:
- 9 DMA: 25,950
- 20 DMA: 25,841
Bank Nifty Key Levels
Support Levels:
- 58,746 – Today's low
- 58,611 – Strong support
- 58,501 – Extended support
Resistance Levels:
- 59,026 – Key resistance (critical for upside)
- 59,166 – Intermediate resistance
- 59,309 – Strong resistance
- 59,440 – All-time high
Moving Averages:
- 9 DMA: 58,788
BSE Sensex Key Levels
Support Levels:
- 84,536 – Today's low
- 84,404 – 20 DMA support
- 84,262 – Strong support zone
Resistance Levels:
- 84,801 – 9 DMA (immediate resistance)
- 84,922 – Minor resistance
- 85,000 – Psychological level
- 85,073 – Strong resistance
- 85,203 – Upside target
Moving Averages:
- 9 DMA: 84,801
- 20 DMA: 84,404
Nifty Predictions – Technical Analysis for Tomorrow

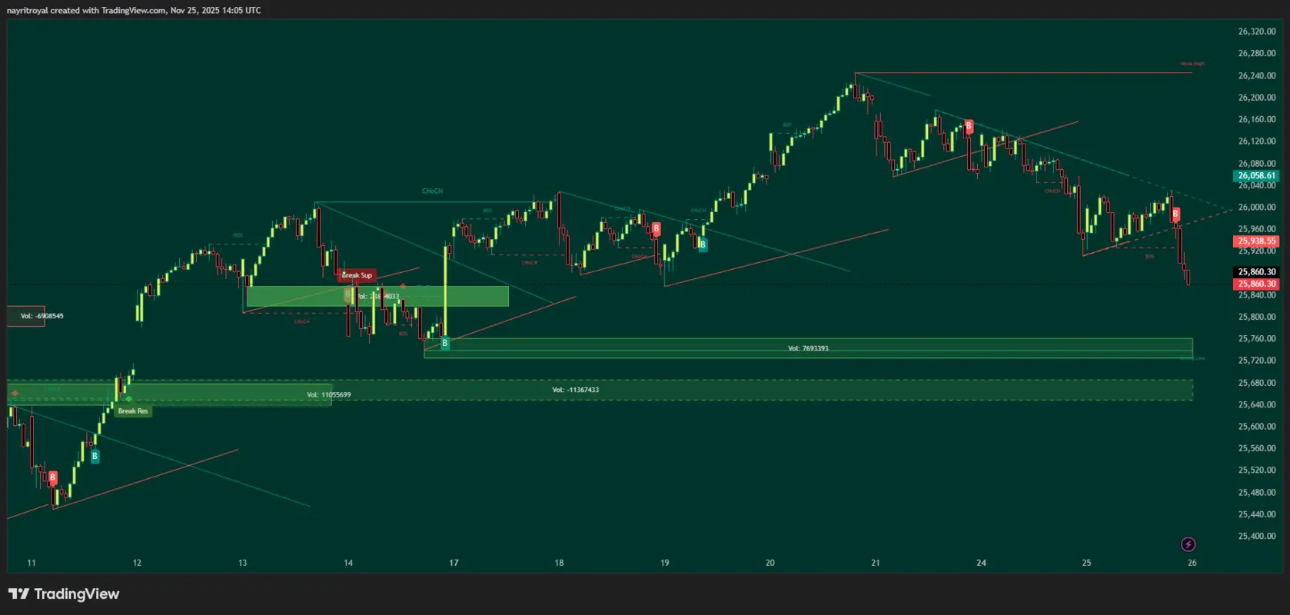
Nifty 50 Technical Chart showing key support and resistance levels for November 26, 2025
Market Outlook: The Nifty 50 has closed below both 9 DMA and near the 20 DMA, indicating short-term weakness. The index needs to reclaim the 25,950 level to turn bullish for the next session.
Bullish Scenario:
- A decisive break above 25,912 will open doors for the index to test the 9 DMA at 25,950
- Sustained trading above 25,950 (9 DMA) can lead to a rally towards 26,000 and 26,052
- Further upside potential exists towards 26,100 if momentum builds
Bearish Scenario:
- Break below today's low of 25,857 will trigger downside momentum
- The 20 DMA at 25,841 is a crucial support that must hold
- Failure to defend 25,841 can drag the index towards 25,798 and 25,757
Trading Strategy:
- Wait for the index to trade above 25,912 for long positions
- Keep stop-loss below 25,857 for intraday trades
- Avoid aggressive positions until a clear directional breakout occurs
Our Opinion: Nifty is likely to remain range-bound between 25,850-26,000 unless a strong breakout occurs. The 9 DMA at 25,950 will be the key level to watch. Traders should exercise caution as the market transitions into the December series.
Bank Nifty Predictions – Technical Analysis

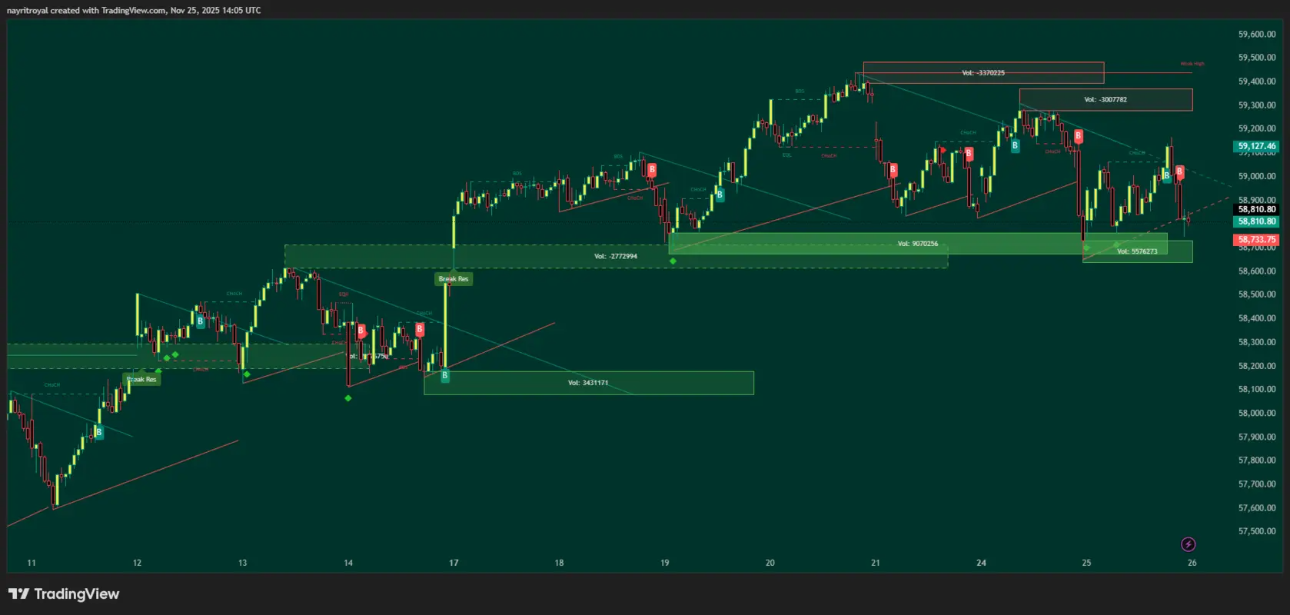
Bank Nifty Technical Chart showing key support and resistance levels for November 26, 2025
Market Outlook: Bank Nifty showed relative strength by holding above the 9 DMA throughout the session. The index is consolidating near the 59,000 zone, which has become a critical resistance.
Bullish Scenario:
- A move above 59,026 will confirm bullish momentum
- The next targets would be 59,166 followed by 59,309
- A strong breakout can push Bank Nifty towards the all-time high of 59,440
Bearish Scenario:
- Break below 58,746 (today's low) will trigger selling pressure
- The immediate support lies at 58,611, followed by 58,501
- The 9 DMA at 58,788 is a crucial level that must be defended
Trading Strategy:
- Buy above 59,026 with targets of 59,166 and 59,309
- Maintain stop-loss below 58,746 for intraday trades
- The 9 DMA at 58,788 can act as a good support for dip buying
Our Opinion: Bank Nifty is exhibiting better technical structure compared to Nifty 50. The index is respecting the 9 DMA support, which is a positive sign. A breakout above 59,026 can lead to a sharp rally towards the all-time high zone. Traders should watch banking stocks like HDFC Bank 0.94%, ICICI Bank 0.77%, and Axis Bank 0.21% for directional cues.
Sensex Predictions – Technical Analysis

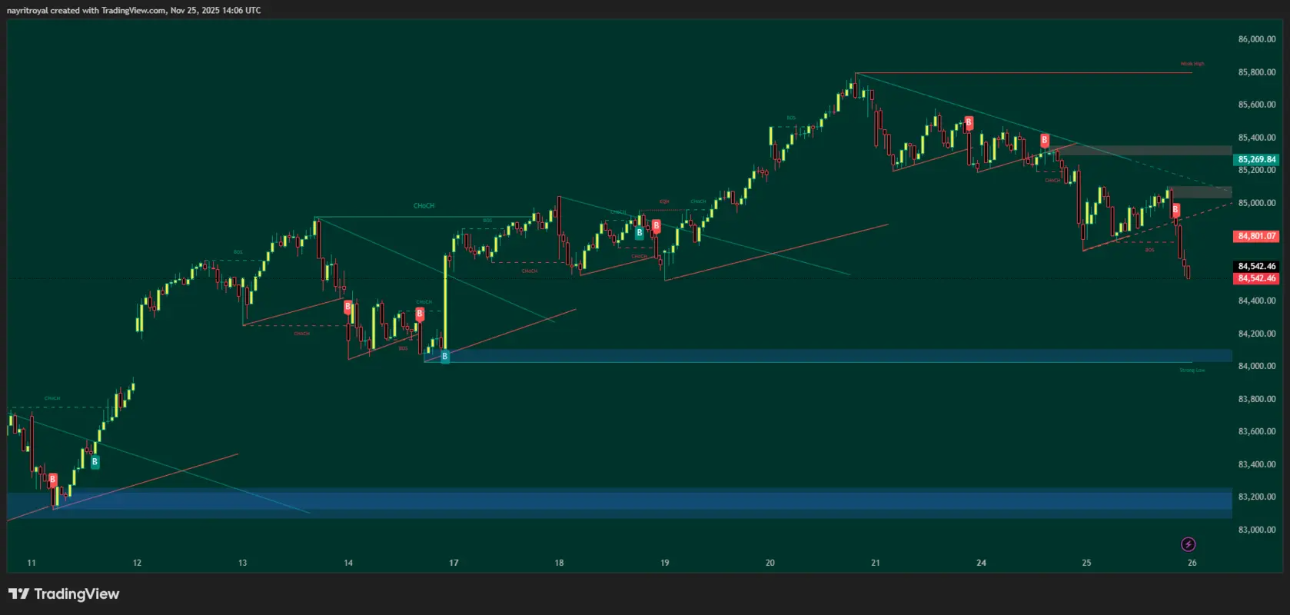
BSE Sensex Technical Chart showing key support and resistance levels for November 26, 2025
Market Outlook: BSE Sensex witnessed heavy selling in the last hour, breaking multiple support levels. The index closed below the 9 DMA, indicating weakness.
Bullish Scenario:
- The index needs to reclaim 84,801 (9 DMA) to turn positive
- Above 84,801, the targets would be 84,922, 85,000, and 85,073
- A strong breakout can push Sensex towards 85,203
Bearish Scenario:
- Break below 84,536 (today's low) will intensify selling
- The 20 DMA at 84,404 is the next major support
- Further downside can extend towards 84,262
Trading Strategy:
- Buy only above 84,801 with strict stop-loss
- Avoid catching falling knives if the index trades below 84,536
- Wait for stability near the 20 DMA (84,404) for fresh long positions
Our Opinion: Sensex is showing weakness after breaking key support levels. The index needs to reclaim the 9 DMA at 84,801 to negate the bearish tone. Heavy weights like Reliance 0.25%, Infosys 1.12%, and Tata Motors 1.59% witnessed selling pressure, which dragged the index lower. Tomorrow's session will be crucial to determine if this is a temporary correction or the beginning of a deeper decline.
Tomorrow's Market Prediction
Overall Market Sentiment: Cautiously bearish to sideways
The Indian Stock Market is expected to open with a gap-down or flat opening on November 26, 2025. The monthly expiry has concluded, and the December series will begin, which typically brings fresh positioning from institutional players.
Key Factors to Watch:
- Global Market Cues: Any overnight developments in global markets, especially US markets, will set the tone
- Banking Sector: Bank Nifty is showing relative strength and could lead the market if it sustains above the 9 DMA
- FII/DII Activity: Net selling by foreign institutional investors has been a concern in recent sessions
- Midcap Index: Nifty Midcap remained range-bound near 13,825 and needs to break above this level for momentum
Sectoral Outlook:
- Banking: Relatively better positioned if Bank Nifty holds 58,746
- IT Sector: Continued weakness with stocks like Infosys under pressure
- Auto Sector: Tata Motors and other auto stocks witnessed selling; cautious approach needed
- Power Sector: Power Grid 0.85% was among the losers
Trading Recommendation:
- Wait for the first 15-30 minutes to gauge market direction
- Focus on stocks showing relative strength rather than indices
- Keep positions light until a clear trend emerges
- Respect stop-losses strictly as volatility may persist
Final Verdict
The Technical Analysis for 26th Nov 2025 suggests that the Indian Stock Market is at a critical juncture. All three major indices – Nifty 50 , Bank Nifty, and BSE Sensex – closed near their respective day lows, indicating weakness. However, Bank Nifty's ability to hold above the 9 DMA is a positive sign.
Key Takeaways:
- Nifty 50: Must reclaim 25,950 (9 DMA) for upside momentum
- Bank Nifty: Relatively strong; watch for breakout above 59,026
- Sensex: Needs to recover 84,801 (9 DMA) to turn positive
The market is likely to remain volatile as it transitions into the December series. The 9 DMA and 20 DMA levels are acting as dynamic support and resistance zones across all indices. Traders should maintain discipline and avoid aggressive positions until a clear directional breakout occurs.
Accuracy Note: Our previous analyses have consistently highlighted the importance of moving averages and key support-resistance levels. Yesterday's prediction of consolidation near key levels played out accurately, with the market remaining range-bound for most of the session before the late-session selloff.
Tomorrow's Expectation: We anticipate a cautious start with potential for recovery if global cues are supportive. The 9 DMA levels across all indices will be the key determinants of intraday momentum.
Disclaimer
Important: This analysis is for educational and informational purposes only. It is not investment advice or a recommendation to buy or sell any securities. The stock market involves substantial risk, and past performance is not indicative of future results. We are not SEBI registered advisors.
Please consult your financial advisor before making any trading or investment decisions. Always conduct your own research and due diligence. Trading in derivatives and equity markets carries significant risk and may not be suitable for all investors. The views expressed are personal opinions based on technical analysis and should not be construed as financial advice.
Risk Warning: Stock market investments are subject to market risks. Please read all related documents carefully before investing