Technical Analysis for 27th Oct 2025
Nifty Predictions, Bank Nifty Predictions & Sensex Predictions
Today's Indian stock market demonstrated notable price action across Nifty 50, Bank Nifty, and Sensex, with each index showing distinct technical patterns. This mobile-friendly article presents a detailed forecast for 27th Oct 2025, referencing main keywords: Technical Analysis, Nifty Predictions, Bank Nifty Predictions, Sensex Predictions, and Market Analysis for Tomorrow.
Key Observations: Today’s Market Closing (24th Oct 2025)
Today's closing prices were as follows:
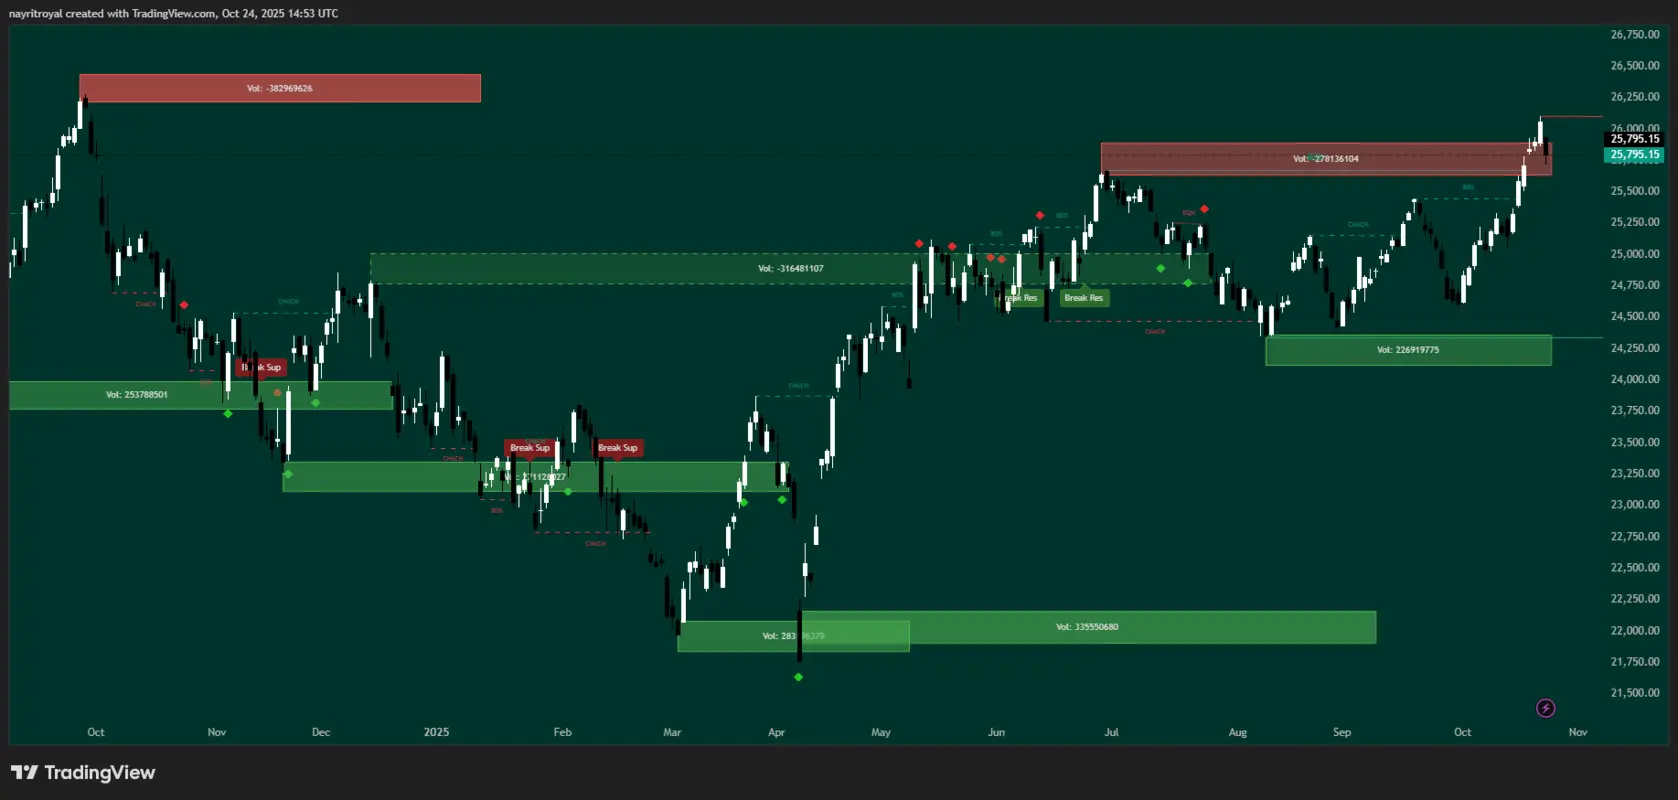
- Nifty 50: 25,795.15
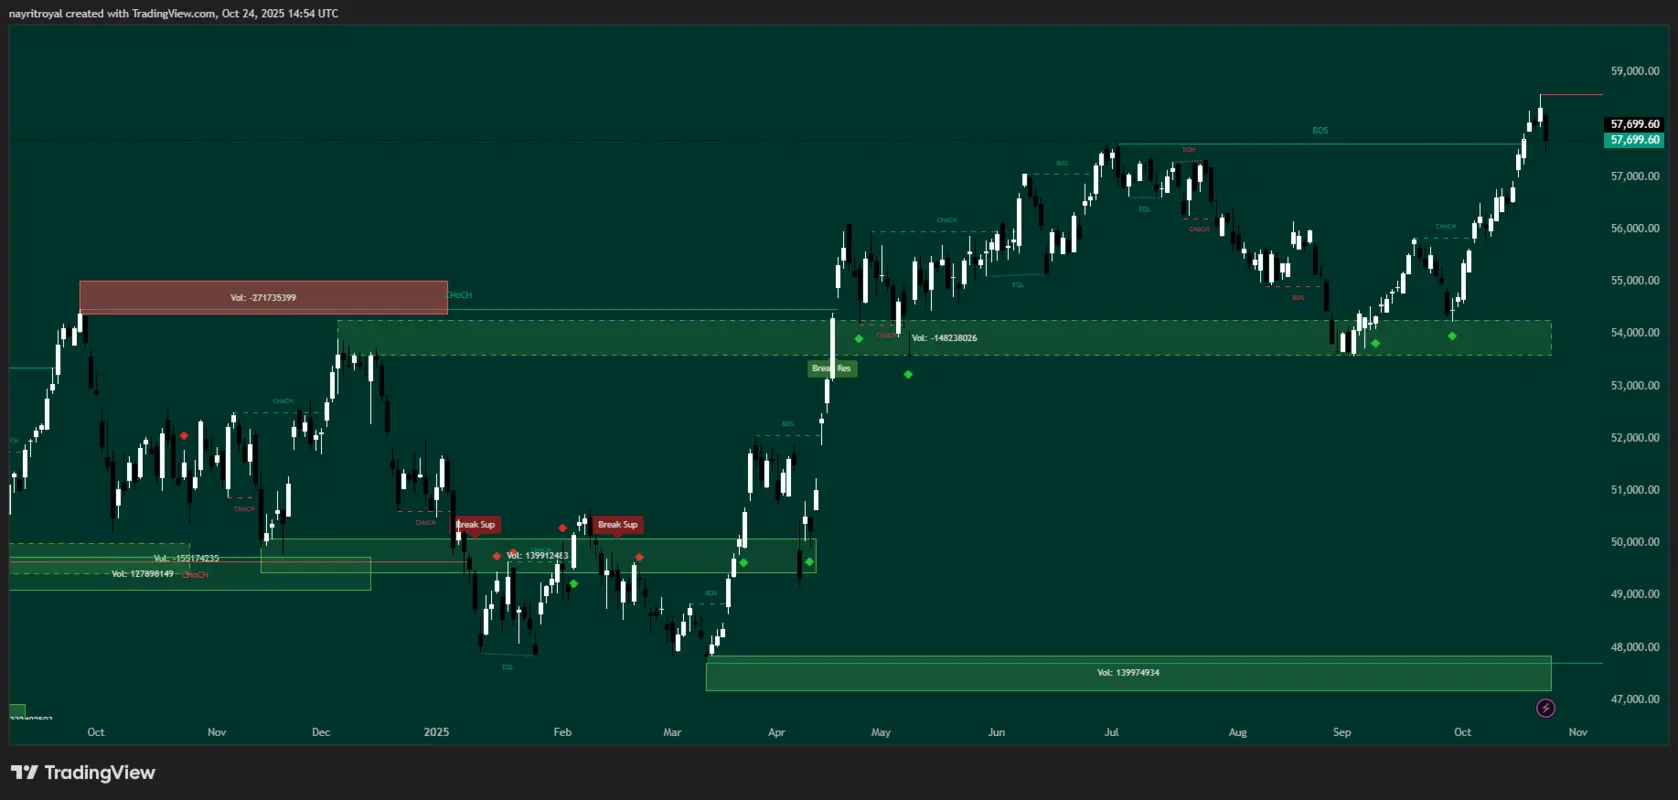
- Bank Nifty: 57,699.60
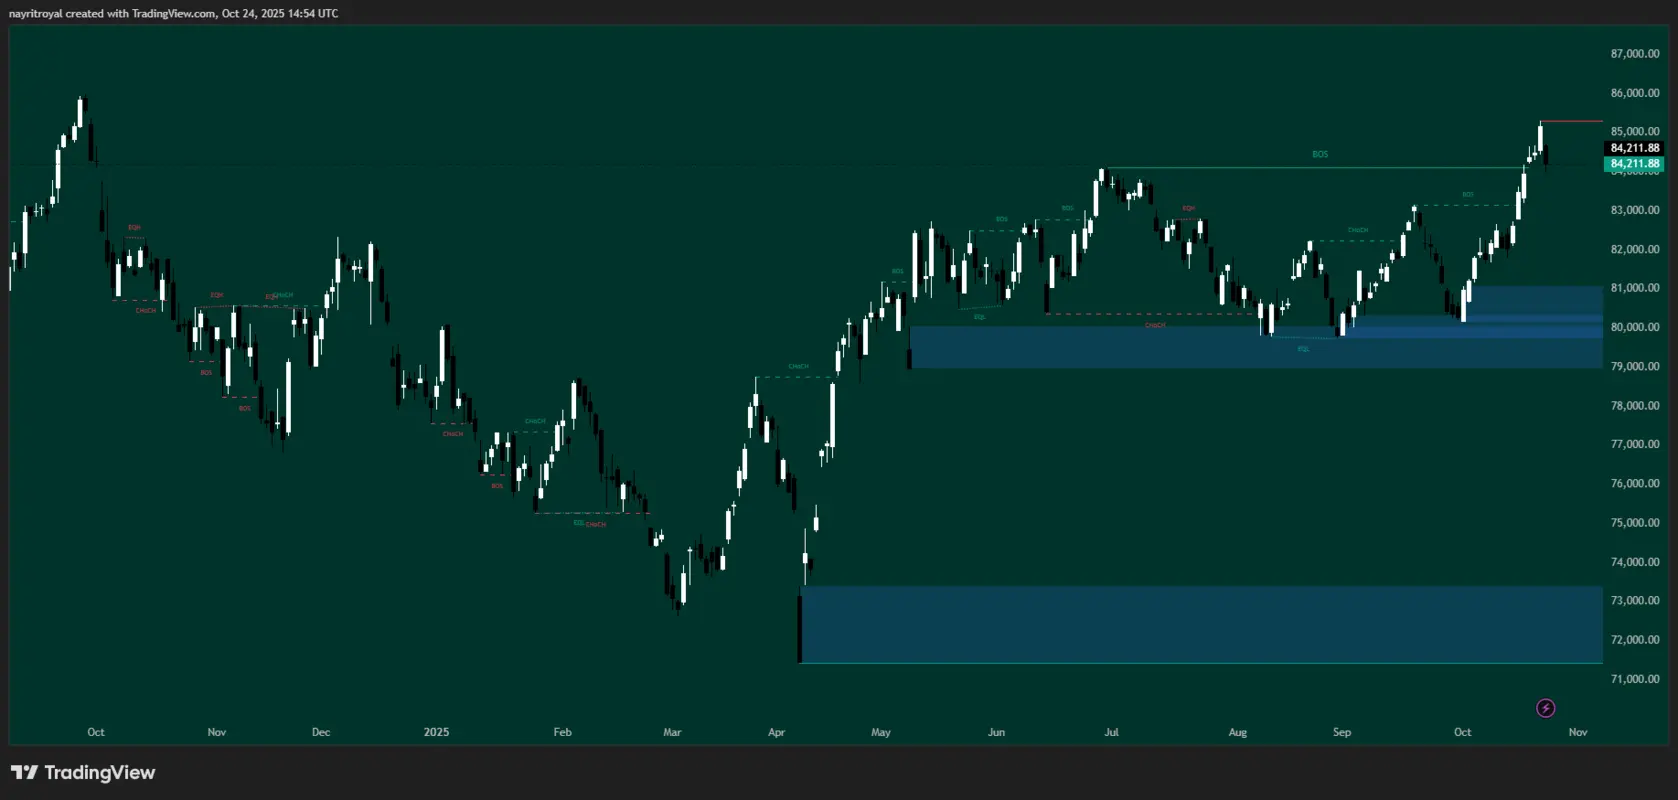
- Sensex: 84,211.88
All three indices posted slight declines, indicating a mild bearish sentiment. The trading ranges, with their respective open, high, and low prices, signal volatility near crucial support and resistance areas:
- Nifty 50: Open 25,935.10 | High 25,939.30 | Low 25,718.90 | Close 25,795.15
- Bank Nifty: Open 58,172.75 | High 58,232.90 | Low 57,483.55 | Close 57,699.60
- Sensex: Open 84,667.23 | High 84,667.23 | Low 83,959.94 | Close 84,211.88
Today's candle forms for Nifty and Bank Nifty suggest minor bearish continuation, whereas Sensex indicates a neutral-to-bearish stance.
Support & Resistance Levels
Understanding support and resistance levels is crucial for navigating the Indian stock market. Below is a summary of major zones for Nifty, Bank Nifty, and Sensex, derived from recent price action and technical indicators.
| Index | Key Support Levels | Key Resistance Levels |
| Nifty 50 | 25,697, 25,621, 25,510, 25,377 | 25,830, 25,909, 25,994, 26,100 |
| Bank Nifty | 57,486, 57,239, 57,000, 56,849 | 57,755, 57,915, 58,257, 58,577 |
| Sensex | 83,950, 83,616, 83,203, 82,790 | 84,337, 84,580, 84,900, 85,250 |
These levels act as pivotal points for potential breakouts or reversals in market prediction scenarios.
Nifty Predictions – Technical Analysis for October 27, 2025
In our Nifty technical analysis, we identify a no-trading zone between 25,697 and 25,830, where price action may remain choppy without clear direction. If a 15-minute candle closes above 25,830, it could signal bullish momentum, targeting 25,909 first, followed by 25,994 and potentially 26,100. However, if the index crosses 25,830 but closes below it on a 15-minute candle, consider short opportunities with targets at 25,750 and 25,650.
On the downside, a 15-minute close below 25,697 might accelerate selling, aiming for 25,621, then 25,510, and 25,377. Conversely, if it crosses 25,697 but closes above, look for upside moves to 25,750 and 25,870. This setup emphasizes patience in the consolidation phase for better market analysis for tomorrow.

- No Trading Zone: Avoid trades between 25,697 and 25,830; wait for a confirmed breakout or breakdown.
- Bullish Strategy: If a 15-minute candle closes above 25,830, targets are sequentially 25,909, 25,994, and 26,100.
- Bearish Strategy: If a 15-minute candle crosses 25,830 but closes below, downside targets are 25,750, then 25,650.
If a 15-minute candle closes below 25,697, further targets become 25,621, 25,510, and 25,377. - Upside Bounce: If 15-minute candle crosses 25,697 but closes above, expect rebounds towards 25,750 and 25,870.
The prevailing sentiment asks traders to observe price action near these levels, with tight stop-loss discipline.
Nifty's chart for the last five sessions enables clear visualization of these zones:
Bank Nifty Predictions – Technical Analysis
For Bank Nifty predictions, the no-trading zone spans 57,486 to 57,755, ideal for range-bound strategies. A 15-minute candle close above 57,755 could trigger upside, with targets at 57,915, 58,257, and 58,577. If it crosses 57,755 but closes below, short-side targets include 57,500 and 57,250.
A close below 57,486 on a 15-minute candle suggests downside pressure, targeting 57,239, 57,000, and 56,849. If it crosses 57,486 but closes above, expect rebounds to 57,700 and 57,900. This Bank Nifty technical analysis highlights banking sector sensitivity to interest rate cues in the Indian stock market.

- No Trading Zone: 57,486 – 57,755; avoid taking positions inside this range to minimize risk.
- Bullish Move: On a 15-minute close above 57,755, first target 57,915, followed by 58,257 and 58,577.
- Bearish Strategy: If a 15-minute candle only crosses 57,755 intrabar but closes below, target 57,500 and then 57,250.
A close below 57,486 invokes 57,239, 57,000, and 56,849 as next support targets. - Upside Play: If a 15-minute candle crosses 57,486 but closes above, anticipate moves to 57,700, then 57,900.
Strong price containment signals suggest waiting for clear momentum before trading.
Bank Nifty’s annotated candlestick chart for recent action clarifies these levels:
Sensex Predictions – Technical Analysis
Sensex predictions show a no-trading zone from 83,950 to 84,337, where sideways movement is likely. A 15-minute close above 84,337 may fuel bullish trades, targeting 84,580, 84,900, and 85,250. If it crosses 84,337 but closes below, short targets are 84,000 and 83,800.
Below 83,950 on a 15-minute close, downside targets include 83,616, 83,203, and 82,790. If crossing 83,950 but closing above, upside to 84,300 and 84,500. This Sensex technical analysis underscores the need for monitoring global cues in market prediction.

- No Trading Zone: 83,950 – 84,337; trade only on breakout confirmation.
- Bullish Play: A 15-minute candle closing above 84,337 sets targets at 84,580, 84,900, and 85,250.
- Bearish Play: If 84,337 is crossed intrabar but the candle closes below, expect targets at 84,000 and 83,800.
- Breakdown Path: On a candle close below 83,950, anticipate 83,616, 83,203, and 82,790 on the downside.
- Upside Turn: If a candle crosses 83,950 but closes above, rebound targets at 84,300, 84,500.
Today's candle suggests limited directional bias, so a confirmed move is needed to set up tomorrow's trades.
Sensex’s chart illustrates the support/resistance context for technical analysis:
Monday’s Market Prediction (October 27)
Outlook:
Market prediction for 27th Oct 2025 is sideways-to-slightly bearish unless decisive moves above/below restricted zones appear. Expect consolidation and volatility spikes near trend-defining levels; traders are advised to be patient and await clear signals before entering positions.
Final Verdict
Previous analyses have consistently anticipated crucial reversal zones and price containment. The accuracy observed in last sessions underlines the relevance of our trading strategy, especially within defined support/resistance areas. Today's review reconfirms our cautious approach, with well-defined no-trading zones and actionable intraday strategies, preparing traders for tomorrow's market.
Disclaimer
This analysis is for educational purposes only. Not investment advice. Please consult your financial advisor before trading.