Elliott Wave Theory:
The Ultimate Guide for Indian Traders
Elliott Wave Theory stands as one of the most influential tools in technical analysis, empowering traders with advanced techniques to forecast market moves and optimize entries and exits. This comprehensive guide is tailored for Indian options and equity traders, combining global theory and practical applications for local markets.
Understanding Elliott Wave Theory
Elliott Wave Theory is built around the concept that market prices move in recurring patterns called “waves,” governed by the collective psychology of investors. These waves appear in all financial instruments—including stocks, options, and indices—and are found across all time frames, from minutes to months.
The Wave Cycles
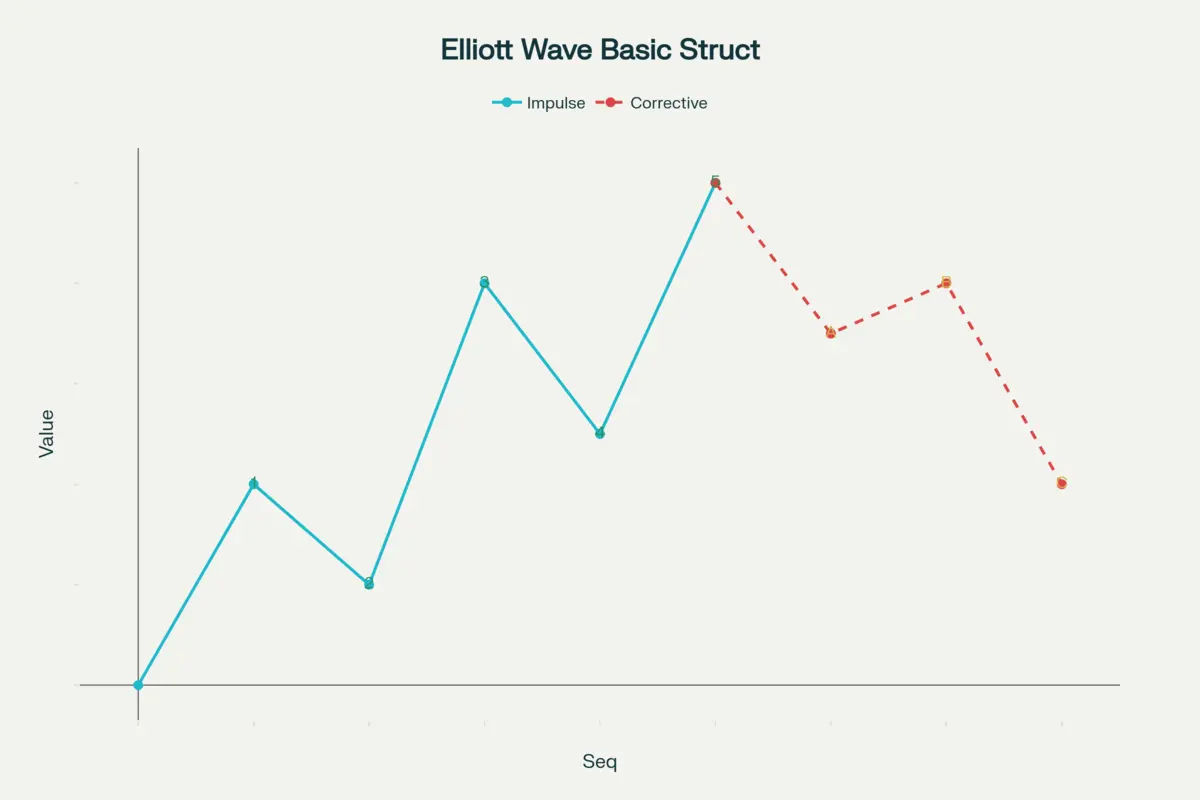
- Impulse Waves (1-5): The main trend in any market is reflected in five consecutive waves. When the primary trend is upward, waves 1, 3, and 5 show strong up-moves, while waves 2 and 4 are corrective but minor pullbacks.
- Corrective Waves (A-B-C): Once five waves complete, the market typically retraces in three corrective waves against the primary direction. These help traders anticipate reversals and take timely action.

Basic Structure of Elliott Wave Theory: 5 Impulse Waves & 3 Corrective Waves
What to Observe
- Waves 1 to 5: Represent the main market move. Wave 3 is often the strongest and longest, showing the market's conviction in the trend.
- Waves A, B, C: Mark the corrective phase, which can provide excellent entry opportunities for new positions or help with profit booking.
- Annotations: Each wave is marked so you can easily recognize the structure—crucial for live trading and back-testing.
How to Apply Elliott Wave Theory in Indian Markets
Steps to Use the Theory:
- Identify Wave Patterns: Start by looking for five-wave impulse patterns and three-wave corrections on your charts (Nifty, Bank Nifty, major stocks).
- Analyze Market Sentiment: Use volume, momentum indicators (like RSI and MACD) to validate wave counts.
- Trade with the Trend: Enter positions during impulse waves and avoid or hedge during corrective phases.
- Set Entry/Exit Points: Use wave terminations as key levels for entries, stop-losses, and profit targets.
- Adapt Across Timeframes: This method is applicable for intraday, swing, and positional trading.
Types of Elliott Wave Chart Patterns
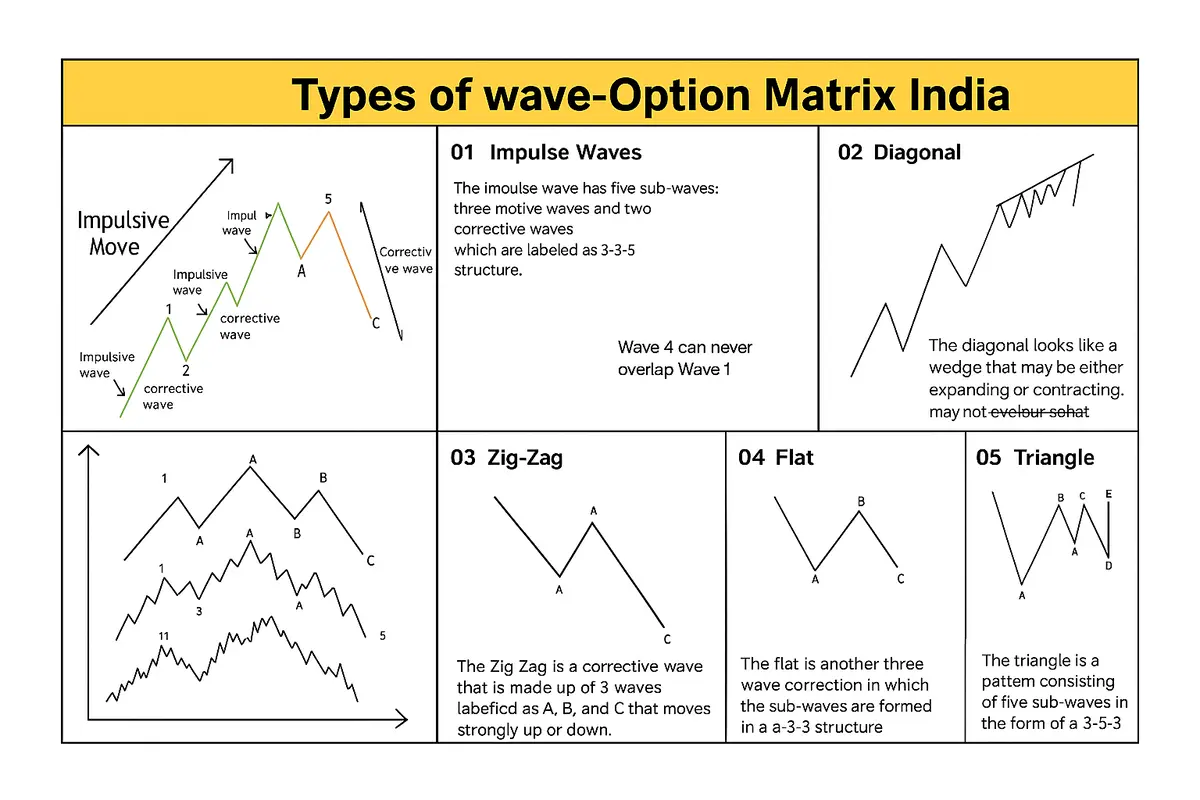
The Elliott Wave Theory delineates a series of distinct wave structures that characterize market price dynamics. Presented here are five fundamental types.

1. Impulse Pattern
The most common Elliott wave pattern in trending markets, consisting of five waves moving in the direction of the main trend (1–2–3–4–5), followed by a three-wave correction (A–B–C).
Example: A strong bull run in Nifty shows the market climbing in five clear swings upward before pulling back in three corrective steps.
2. Diagonal Pattern
Diagonals appear as wedge-shaped structures, often forming in wave 1 or wave 5 (leading or ending diagonals). In these patterns, waves 1, 3, and 5 can overlap with waves 2 and 4.
Example: An ending diagonal at the top of a rally: prices make higher highs and higher lows, but the rises become less powerful, forming a narrowing wedge before a reversal.
3. Zigzag Pattern
A corrective pattern with a sharp drop, quick recovery, and another drop (A–B–C). Each leg (A and C) typically subdivides into five smaller waves, while Wave B subdivides into three.
Example: After a strong upward impulse, a stock reverses sharply for Wave A, recovers briefly for Wave B, then drops further in Wave C, forming a zigzag correction.
4. Flat Pattern
A sideways correction where the market fails to make new highs or lows. The pattern forms in three waves: A–B–C, with all waves roughly equal in length.
Example: After a steady uptrend, a stock trades sideways: Wave A drops, Wave B recovers back near the prior top, Wave C drops again, forming a “flat” structure.
5. Triangle Pattern
A consolidation pattern occurring typically in wave 4 or B, consisting of five overlapping waves (A–B–C–D–E) moving sideways and converging into a point.
Example: A stock rallies, then in wave 4, price moves in narrowing swings (A–B–C–D–E) before breaking out in wave 5 towards the next trend
Why Indian Traders Should Use Elliott Wave Theory
- Forecast Reversals: Anticipate market tops and bottoms with greater accuracy.
- Enhance Risk Management: Place stops effectively by understanding where waves could reverse.
- Works on All Assets: Whether you trade equity, options, or indices, Elliott Wave principles apply.
- Improve Consistency: Establish a system for trading based on repeatable market patterns.
Pro Tips from Option Matrix India
- Back-test your wave counts before relying on them for live trading.
- Combine Elliott Wave Theory with support/resistance and volume analysis for higher conviction.
- Adjust wave counts as new price action emerges—markets are dynamic and wave structures evolve.
- Focus on the bigger picture to avoid being misled by minor wave fluctuations.
Conclusion
Elliott Wave Theory delivers a systematic approach to dissecting market trends, making it an essential tool for every serious Indian trader. By mastering wave identification and combining it with other technical indicators, you can make better decisions, avoid common traps, and boost your trading performance.
Want to level up your trading? Study the chart above, practice wave counts on historical data, and apply the method to your favorite stocks and indices.
Visit Option Matrix India for more guides on market analysis, trading strategies, and expert tips crafted for Indian market conditions.