
MACD Indicator – Complete Trading Guide for Indian Stock Market Traders
Master the Moving Average Convergence Divergence indicator with proven strategies, best settings, and actionable signals for NSE, Nifty, Bank Nifty, and options trading.
Introduction to MACD Indicator
The MACD (Moving Average Convergence Divergence) indicator is one of the most widely used and trusted momentum indicators in technical analysis. Whether you trade Nifty 50, Bank Nifty, individual stocks on the NSE, or explore options trading strategies, understanding MACD can significantly enhance your trading decisions and overall market analysis.
Developed by Gerald Appel in the late 1970s, the MACD indicator has stood the test of time and remains a core tool in virtually every professional trader's arsenal. It elegantly combines trend-following analysis with momentum measurement, making it versatile for both beginner and experienced Indian stock market traders.

Why Indian Traders Rely on MACD
Over 70% of professional Indian traders and institutional analysts use MACD as a primary or confirming indicator for entries and exits. It works across Nifty, Bank Nifty, Sensex, and individual NSE/BSE stocks in all timeframes — from 1-minute scalping to weekly swing trading charts.
In this guide, we cover everything about MACD — from its basic components and how it works, to advanced strategies like divergence trading, histogram analysis, and multi-indicator confirmation techniques. By the end, you will have a complete, actionable understanding of how to use MACD in your daily trading workflow.
What is MACD Indicator?
MACD stands for Moving Average Convergence Divergence. It is a trend-following momentum indicator that reveals the relationship between two exponential moving averages (EMAs) of a security's price. Developed by Gerald Appel in 1979, it has become one of the most popular tools on virtually every charting platform used by Indian traders.
At its core, MACD measures convergence (moving averages coming together) and divergence (moving averages moving apart). When the fast EMA moves above the slow EMA, it indicates bullish momentum. When it moves below, it indicates bearish momentum.
Key Takeaway
MACD is a complete system consisting of three elements: MACD Line, Signal Line, and Histogram. Together, they provide comprehensive insight into trend direction, momentum strength, and potential reversal points.
Components of MACD Indicator
The MACD indicator is composed of three critical components. Understanding each one is essential before applying any MACD-based trading strategy.
MACD Line
The primary line representing the difference between 12-period and 26-period EMAs. It reacts quickly to price changes.
Signal Line
A 9-period EMA of the MACD line. It acts as a trigger for buy and sell signals through crossovers.
Histogram
The visual gap between MACD and Signal lines. Expanding bars = strong momentum, shrinking bars = weakening momentum.
How MACD Works
Understanding the mechanics of MACD is crucial. The indicator tracks convergence and divergence of two EMAs. Here is how market conditions reflect in MACD readings:
🟢 Bullish Momentum
12 EMA moves above 26 EMA. MACD line turns positive. Green histogram bars expand. Buying pressure is increasing — a key signal for Nifty and Bank Nifty traders.
🔴 Bearish Momentum
12 EMA crosses below 26 EMA. MACD line turns negative. Red histogram bars expand downward. Indicates increasing selling pressure — useful for short-selling or put options on NSE.
🔄 Trend Reversal
MACD line crosses Signal line in opposite direction while histogram changes color. Divergences between price and MACD often precede reversals — powerful for swing traders.
📈 Trend Continuation
MACD stays above zero with expanding histogram confirms uptrend continuation. Below zero with expanding negative histogram confirms bearish continuation.

Best MACD Settings for Trading
The default MACD setting of 12, 26, 9 works well for most situations. However, different trading styles benefit from different configurations:
| Trading Style | Setting | Timeframe | Advantages | Disadvantages |
|---|---|---|---|---|
| Scalping | 3, 10, 1 | 1–3 min | Ultra-fast signals | Many false signals |
| Intraday | 5, 13, 1 | 5–15 min | Faster response | More whipsaws |
| Standard | 12, 26, 9 | 15 min–1 hr | Best balance | Slight lag |
| Swing | 12, 26, 9 | Daily | Reliable signals | May miss early entries |
| Positional | 24, 52, 18 | Daily–Weekly | Very smooth | Very slow to react |
Recommended for NSE Traders
For most Indian stock market traders dealing with Nifty, Bank Nifty, and large-cap stocks, the default 12, 26, 9 setting on a 15-minute or daily chart remains the most reliable configuration.
How to Apply MACD on TradingView
Open Chart
Go to TradingView.com and open any stock — type "NIFTY" or "RELIANCE" to select the NSE chart.
Open Indicators Panel
Click the "Indicators" button (fx icon) at the top toolbar, or press "/" for quick search.
Search for MACD
Type "MACD" and select from built-in indicators. Default 12, 26, 9 settings are applied automatically.
Apply and Verify
MACD appears in a separate panel below the chart showing MACD Line, Signal Line, and Histogram bars.
Customize Settings
Double-click the MACD label to change Fast Length, Slow Length, and Signal Smoothing based on your trading style.
MACD Buy Signals
Bullish Crossover
A bullish crossover occurs when the MACD line crosses above the signal line from below. This is the most common MACD buy signal, indicating short-term momentum is shifting upward.
✅ Buy Signal
When MACD line crosses above Signal line → Consider long position or call options. Best when crossover happens below zero line and pushes above it.
Zero Line Breakout
When the MACD line crosses from negative to positive territory (above zero), it confirms the 12 EMA has moved above 26 EMA — a strong bullish trend confirmation, particularly reliable on daily charts for Nifty and large-cap NSE stocks.
Positive Histogram Expansion
When histogram bars turn green and expand, the gap between MACD and Signal line is increasing — accelerating bullish momentum. On stocks like Reliance, HDFC Bank, or Infosys, expanding positive histogram on daily charts often precedes strong multi-day rallies.
Pro Tip for NSE Traders
The strongest MACD buy signals occur when a bullish crossover happens below the zero line while price is near support and volume is increasing. This triple confirmation has a significantly higher success rate.
MACD Sell Signals
Bearish Crossover
A bearish crossover occurs when the MACD line crosses below the signal line. This is the primary sell or short-entry signal, indicating short-term momentum is shifting downward.
Zero Line Breakdown
When MACD drops from positive to negative territory, it confirms 12 EMA has crossed below 26 EMA — bearish trend confirmation, especially significant on daily and weekly Nifty charts.
Negative Histogram Expansion
Expanding red histogram bars signal increasing bearish momentum. The wider the gap, the stronger the selling pressure — hold short positions or avoid bottom-fishing.
⚠️ Important Warning
Never rely on a single MACD sell signal in isolation. Always confirm with volume, price action, and broader market trend (Nifty direction). False bearish crossovers are common in strong uptrends.
MACD Histogram Explained
The histogram is the most actionable part of MACD. Many professionals focus primarily on it because it provides the earliest signals about momentum changes.
🟢 Green Histogram
MACD line above Signal line. Bullish momentum. Taller bars = stronger upward momentum. Green bars after red signal potential upside reversal.
🔴 Red Histogram
MACD line below Signal line. Bearish momentum. Expanding red bars confirm increasing selling pressure — warning for long holders.
📈 Increasing Bars
Increasing height = accelerating momentum. Time to ride the trend. Professionals use expanding histogram as a "stay-in-trade" signal.
📉 Decreasing Bars
Shrinking bars = weakening momentum. First warning that crossover is approaching — tighten stop losses.
MACD Divergence Strategy
MACD divergence is one of the most powerful concepts in technical analysis. Divergence occurs when price and MACD disagree — often signaling an imminent trend reversal.
Bullish Divergence
Definition: Price makes a lower low, but MACD makes a higher low.
Interpretation: Momentum is improving despite falling prices. Often appears at end of downtrends.
NSE Example: Nifty drops from 22,000 to 21,500 (lower low) while MACD forms higher low — selling pressure is exhausting.
Bearish Divergence
Definition: Price makes a higher high, but MACD makes a lower high.
Interpretation: Momentum weakening despite new highs. Often appears near market tops.
NSE Example: Bank Nifty rallies to 49,500 (higher high) while MACD peaks lower — rally losing steam.
Critical Rule
Always wait for a confirming signal before acting on divergence. Ensure divergence is backed by adequate volume. Divergence without volume confirmation has much lower success rate.
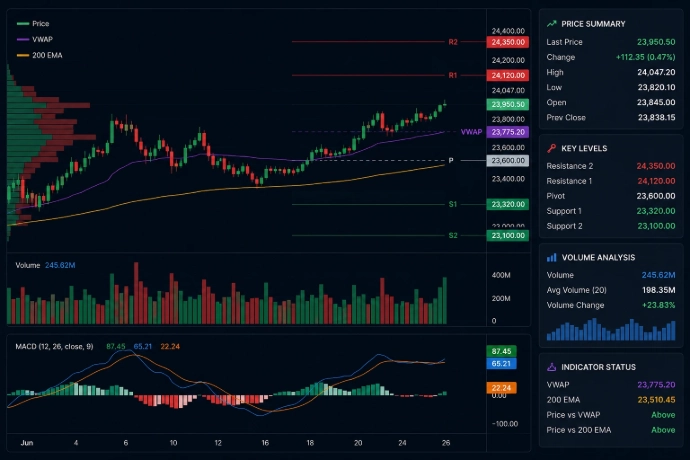
Best MACD Trading Strategy for NSE Traders
📋 Entry Conditions (Long)
- Price must be trading above the 200 EMA (uptrend confirmed)
- MACD line crosses above Signal line
- Crossover occurs near or above zero line
- Volume above 20-period average on crossover candle
- Enter at close of crossover candle
📋 Exit & Risk Management
- Stop Loss: Below most recent swing low
- Target 1: 1:1 RR (book 50%)
- Target 2: 1:2 RR (trail remaining with MACD)
- Exit: When MACD gives bearish crossover
- Position Size: Risk max 1-2% capital per trade
MACD with Other Indicators
| Combination | Use Case | How It Works | Best For |
|---|---|---|---|
| MACD + RSI | Momentum | Crossover + RSI 40-60 zone confirms entry | Swing Trading |
| MACD + VWAP | Intraday | Buy signal + price above VWAP = long | Intraday |
| MACD + Bollinger | Breakout | Crossover near BB squeeze confirms breakout | Breakout |
| MACD + Price Action | Confirmation | Confirms candlestick patterns | All Timeframes |
| MACD + Volume | Validation | Above-avg volume confirms signal | All Styles |
MACD for Nifty and Bank Nifty Trading
📊 Index Trading
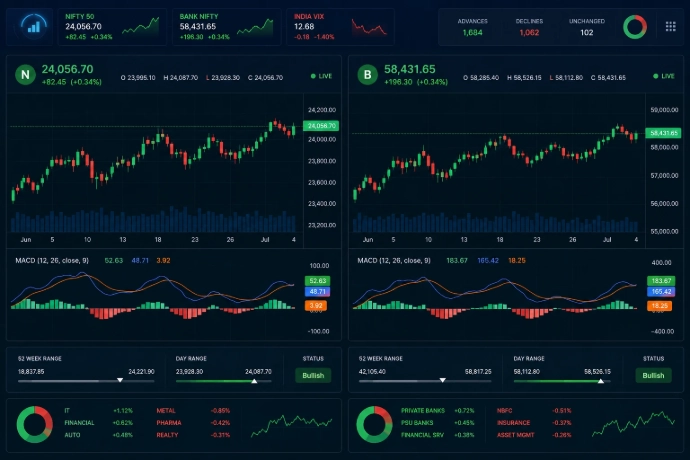
Use MACD on 15-min or hourly charts for Nifty/Bank Nifty futures. Default 12,26,9 works best. With Nifty trading around 23,000-24,000, daily MACD crossovers provide reliable directional signals.
📈 Options Trading
Use MACD on 15-min chart to time directional option buys. Bullish crossover near support → buy calls. Bearish crossover near resistance → buy puts. Always check IV before entering.
⚡ Weekly Expiry
For weekly expiry, use 5-min chart with 5,13,1 settings. Be cautious of theta decay — avoid holding long options based solely on MACD within last 2 hours before expiry.
🕐 Intraday
Combine MACD with VWAP and 200 EMA on 5 or 15-min chart. Only take MACD buys when price is above VWAP and 200 EMA. Triple-filter reduces false signals during volatile hours.
MACD for Stock Trading
Large-Cap Stocks
Reliance, TCS, HDFC Bank — use default settings on daily charts. Signals are reliable due to high liquidity. Best for swing and positional trading.
Mid-Cap Stocks
More volatile MACD patterns. Use slightly slower settings (14,30,9) to filter noise. Always confirm with volume and sector trend.
Momentum Stocks
High-beta stocks respond to faster settings (8,17,9). Clear histogram expansions before major moves. Ideal for short-term F&O plays.
MACD Success Rate
No indicator provides guaranteed accuracy. Here are approximate observed performance ranges:
Market Condition Dependency
These rates are approximate. MACD performs best in trending markets and underperforms in sideways markets. During high-volatility events (RBI policy, Budget, elections), signals can be unreliable.
MACD Signals to Ignore
❌ Sideways Market Crossovers
In narrow range markets, MACD produces multiple crossovers leading nowhere. Histogram stays small and choppy. Avoid when 20-period ATR is below average.
❌ Multiple Crossovers in Small Range
3-4 crossovers with MACD hovering near zero = market indecisive. Wait for clear break away from zero.
❌ Divergence Without Volume
Divergence without above-average volume has low predictive value. Low-volume divergences on mid/small-cap NSE stocks are unreliable.
❌ Signal Against Higher Timeframe
A 5-min buy signal while daily MACD is bearish is low-probability. Always align with higher timeframe trend.
❌ Expiry Day Noise
On weekly expiry days, MACD signals become unreliable due to gamma-driven swings and abnormal volume patterns.
❌ News Event Volatility
News-driven MACD signals often reverse. Wait for dust to settle before acting on post-event crossovers.
❌ Low Volume / Illiquid Stocks
MACD fails on low-volume stocks. Stick to stocks with daily volume above 5 lakh shares on NSE.
Common Mistakes Traders Make
🚫 Entering Too Early
Many traders enter before the crossover candle closes. Always wait for candle close to confirm signal.
🚫 Ignoring the Trend
Taking MACD buys in a clear downtrend = losses. Confirm broader trend using 200 EMA or higher timeframe.
🚫 Ignoring Volume
Crossover without volume = weak signal. Volume validates strength behind any movement.
🚫 Overtrading Crossovers
Acting on every crossover = death by thousand cuts. Be selective — trade only highest conviction setups.
Advantages of MACD
✅ Easy to Understand
Simple visual interpretation — crossovers, histogram, zero line make it beginner-friendly.
✅ Dual Function
Combines trend-following and momentum analysis in a single indicator.
✅ All Timeframes
Effective on 1-minute to weekly charts — versatile for all trading styles.
✅ Available Everywhere
Built into TradingView, Zerodha Kite, Upstox, Angel One, MetaTrader.
✅ Divergence Detection
Excellent at identifying divergences preceding major reversals.
✅ Customizable
Settings adjustable for faster or slower signals matching any style.
Limitations of MACD
⚠️ Lagging Indicator
Based on moving averages, signals come after the move has started.
⚠️ Poor in Sideways Markets
Generates numerous false crossovers during range-bound conditions.
⚠️ No OB/OS Levels
Unlike RSI, has no fixed overbought/oversold boundaries.
⚠️ False Divergences
Not all divergences lead to reversals — some persist for weeks.
⚠️ Needs Confirmation
Moderate success rate alone — requires volume, price action, or other indicators.
⚠️ Whipsaws
High-volatility events cause rapid alternating signals and repeated stop hits.
Complete MACD Trading Checklist
MACD Trading Example
📊 Example: Long Trade on Reliance Industries (NSE)
Chart Setup: Daily chart with MACD (12, 26, 9) and 200 EMA
Outcome: Price moved to ₹2,620 in 8 sessions. T1 hit. Remaining trailed until bearish crossover at ₹2,595. Profit: ₹145-170/share.
MACD vs RSI vs Moving Average vs Supertrend
MACD vs RSI
| Feature | MACD | RSI |
|---|---|---|
| Type | Trend + Momentum | Momentum Oscillator |
| Range | Unbounded (around zero) | 0 to 100 |
| OB/OS Levels | No fixed levels | 70/30 standard |
| Best Use | Trend direction & entries | OB/OS conditions |
| Divergence | Excellent | Good |
| Best Market | Trending | Range-bound & trending |
| Combined | Together = momentum + trend + OB/OS analysis | |
MACD vs Moving Average
| Feature | MACD | Moving Average |
|---|---|---|
| Type | Oscillator (separate panel) | Overlay (on chart) |
| Shows | Momentum + trend strength | Trend + support/resistance |
| Histogram | Yes | No |
| Divergence | Can detect | Cannot detect |
| Best Combo | MAs for trend direction + MACD for entry/exit timing | |
MACD vs Supertrend
| Feature | MACD | Supertrend |
|---|---|---|
| Type | Oscillator | Overlay (trend-following) |
| Basis | EMA convergence | ATR based |
| Signal Clarity | Requires interpretation | Very clear (green/red) |
| Stop Loss | Not built-in | Built-in via ST line |
| Momentum | Via histogram | None |
| Best Combo | Supertrend for direction + trailing stop, MACD for entry timing | |
Frequently Asked Questions
Conclusion
The MACD indicator remains one of the most powerful, versatile, and reliable tools in a trader's technical analysis toolkit. Whether you are an intraday trader, swing trader, or options trader on the NSE, MACD provides invaluable insights into trend direction, momentum strength, and potential reversal points.
🎯 Key Takeaways
- MACD combines trend and momentum — a dual-purpose tool reducing chart clutter
- Default settings (12, 26, 9) remain the most reliable for most NSE trading scenarios
- Always filter signals with trend direction (200 EMA), volume, and price action
- Divergence analysis is MACD's most powerful feature for reversal trades
- Avoid MACD in sideways markets — excessive false signals
- Risk management is non-negotiable — always use stop losses and proper position sizing
- Combining MACD with RSI, VWAP, or Supertrend significantly improves results
- Practice on paper trading before deploying with real capital
The key to successful trading is not finding a perfect indicator — it is using reliable tools like MACD consistently, with proper risk management, emotional discipline, and continuous learning.
Continue Learning with Option Matrix India
This guide is part of our Technical Analysis Education Series. Explore our guides on RSI, Supertrend, Bollinger Bands, VWAP, and Price Action to build a complete trading system.
⚠️ Important Disclaimer
This article is for educational and informational purposes only. It does not constitute financial advice, investment recommendations, or trading signals. Trading in stocks, futures, and options involves substantial risk of loss.
Past performance of any indicator, including MACD, does not guarantee future results. Success rates mentioned are approximate estimates — actual results vary based on market conditions and individual execution.
Always do your own research (DYOR) before making trading decisions. Consult a SEBI-registered financial advisor for personalized advice. Option Matrix India shall not be held responsible for any trading losses.
Stock market investments are subject to market risks. Please read all scheme-related documents carefully before investing.
MACD Indicator – Complete Trading Guide for Indian Stock Market Traders
Master the Moving Average Convergence Divergence indicator with proven strategies, best settings, and actionable signals for NSE, Nifty, Bank Nifty, and options trading.
Introduction to MACD Indicator
The MACD (Moving Average Convergence Divergence) indicator is one of the most widely used and trusted momentum indicators in technical analysis. Whether you trade Nifty 50, Bank Nifty, individual stocks on the NSE, or explore options trading strategies, understanding MACD can significantly enhance your trading decisions and overall market analysis.
Developed by Gerald Appel in the late 1970s, the MACD indicator has stood the test of time and remains a core tool in virtually every professional trader's arsenal. It elegantly combines trend-following analysis with momentum measurement, making it versatile for both beginner and experienced Indian stock market traders.
Why Indian Traders Rely on MACD
Over 70% of professional Indian traders and institutional analysts use MACD as a primary or confirming indicator for entries and exits. It works across Nifty, Bank Nifty, Sensex, and individual NSE/BSE stocks in all timeframes — from 1-minute scalping to weekly swing trading charts.
In this guide, we cover everything about MACD — from its basic components and how it works, to advanced strategies like divergence trading, histogram analysis, and multi-indicator confirmation techniques. By the end, you will have a complete, actionable understanding of how to use MACD in your daily trading workflow.
What is MACD Indicator?
MACD stands for Moving Average Convergence Divergence. It is a trend-following momentum indicator that reveals the relationship between two exponential moving averages (EMAs) of a security's price. Developed by Gerald Appel in 1979, it has become one of the most popular tools on virtually every charting platform used by Indian traders.
At its core, MACD measures convergence (moving averages coming together) and divergence (moving averages moving apart). When the fast EMA moves above the slow EMA, it indicates bullish momentum. When it moves below, it indicates bearish momentum.
Key Takeaway
MACD is a complete system consisting of three elements: MACD Line, Signal Line, and Histogram. Together, they provide comprehensive insight into trend direction, momentum strength, and potential reversal points.
Components of MACD Indicator
The MACD indicator is composed of three critical components. Understanding each one is essential before applying any MACD-based trading strategy.
MACD Line
The primary line representing the difference between 12-period and 26-period EMAs. It reacts quickly to price changes.
Signal Line
A 9-period EMA of the MACD line. It acts as a trigger for buy and sell signals through crossovers.
Histogram
The visual gap between MACD and Signal lines. Expanding bars = strong momentum, shrinking bars = weakening momentum.
How MACD Works
Understanding the mechanics of MACD is crucial. The indicator tracks convergence and divergence of two EMAs. Here is how market conditions reflect in MACD readings:
🟢 Bullish Momentum
12 EMA moves above 26 EMA. MACD line turns positive. Green histogram bars expand. Buying pressure is increasing — a key signal for Nifty and Bank Nifty traders.
🔴 Bearish Momentum
12 EMA crosses below 26 EMA. MACD line turns negative. Red histogram bars expand downward. Indicates increasing selling pressure — useful for short-selling or put options on NSE.
🔄 Trend Reversal
MACD line crosses Signal line in opposite direction while histogram changes color. Divergences between price and MACD often precede reversals — powerful for swing traders.
📈 Trend Continuation
MACD stays above zero with expanding histogram confirms uptrend continuation. Below zero with expanding negative histogram confirms bearish continuation.
Best MACD Settings for Trading
The default MACD setting of 12, 26, 9 works well for most situations. However, different trading styles benefit from different configurations:
| Trading Style | Setting | Timeframe | Advantages | Disadvantages |
|---|---|---|---|---|
| Scalping | 3, 10, 1 | 1–3 min | Ultra-fast signals | Many false signals |
| Intraday | 5, 13, 1 | 5–15 min | Faster response | More whipsaws |
| Standard | 12, 26, 9 | 15 min–1 hr | Best balance | Slight lag |
| Swing | 12, 26, 9 | Daily | Reliable signals | May miss early entries |
| Positional | 24, 52, 18 | Daily–Weekly | Very smooth | Very slow to react |
Recommended for NSE Traders
For most Indian stock market traders dealing with Nifty, Bank Nifty, and large-cap stocks, the default 12, 26, 9 setting on a 15-minute or daily chart remains the most reliable configuration.
How to Apply MACD on TradingView
Open Chart
Go to TradingView.com and open any stock — type "NIFTY" or "RELIANCE" to select the NSE chart.
Open Indicators Panel
Click the "Indicators" button (fx icon) at the top toolbar, or press "/" for quick search.
Search for MACD
Type "MACD" and select from built-in indicators. Default 12, 26, 9 settings are applied automatically.
Apply and Verify
MACD appears in a separate panel below the chart showing MACD Line, Signal Line, and Histogram bars.
Customize Settings
Double-click the MACD label to change Fast Length, Slow Length, and Signal Smoothing based on your trading style.
MACD Buy Signals
Bullish Crossover
A bullish crossover occurs when the MACD line crosses above the signal line from below. This is the most common MACD buy signal, indicating short-term momentum is shifting upward.
✅ Buy Signal
When MACD line crosses above Signal line → Consider long position or call options. Best when crossover happens below zero line and pushes above it.
Zero Line Breakout
When the MACD line crosses from negative to positive territory (above zero), it confirms the 12 EMA has moved above 26 EMA — a strong bullish trend confirmation, particularly reliable on daily charts for Nifty and large-cap NSE stocks.
Positive Histogram Expansion
When histogram bars turn green and expand, the gap between MACD and Signal line is increasing — accelerating bullish momentum. On stocks like Reliance, HDFC Bank, or Infosys, expanding positive histogram on daily charts often precedes strong multi-day rallies.
Pro Tip for NSE Traders
The strongest MACD buy signals occur when a bullish crossover happens below the zero line while price is near support and volume is increasing. This triple confirmation has a significantly higher success rate.
MACD Sell Signals
Bearish Crossover
A bearish crossover occurs when the MACD line crosses below the signal line. This is the primary sell or short-entry signal, indicating short-term momentum is shifting downward.
Zero Line Breakdown
When MACD drops from positive to negative territory, it confirms 12 EMA has crossed below 26 EMA — bearish trend confirmation, especially significant on daily and weekly Nifty charts.
Negative Histogram Expansion
Expanding red histogram bars signal increasing bearish momentum. The wider the gap, the stronger the selling pressure — hold short positions or avoid bottom-fishing.
⚠️ Important Warning
Never rely on a single MACD sell signal in isolation. Always confirm with volume, price action, and broader market trend (Nifty direction). False bearish crossovers are common in strong uptrends.
MACD Histogram Explained
The histogram is the most actionable part of MACD. Many professionals focus primarily on it because it provides the earliest signals about momentum changes.
🟢 Green Histogram
MACD line above Signal line. Bullish momentum. Taller bars = stronger upward momentum. Green bars after red signal potential upside reversal.
🔴 Red Histogram
MACD line below Signal line. Bearish momentum. Expanding red bars confirm increasing selling pressure — warning for long holders.
📈 Increasing Bars
Increasing height = accelerating momentum. Time to ride the trend. Professionals use expanding histogram as a "stay-in-trade" signal.
📉 Decreasing Bars
Shrinking bars = weakening momentum. First warning that crossover is approaching — tighten stop losses.
MACD Divergence Strategy
MACD divergence is one of the most powerful concepts in technical analysis. Divergence occurs when price and MACD disagree — often signaling an imminent trend reversal.
Bullish Divergence
Definition: Price makes a lower low, but MACD makes a higher low.
Interpretation: Momentum is improving despite falling prices. Often appears at end of downtrends.
NSE Example: Nifty drops from 22,000 to 21,500 (lower low) while MACD forms higher low — selling pressure is exhausting.
Bearish Divergence
Definition: Price makes a higher high, but MACD makes a lower high.
Interpretation: Momentum weakening despite new highs. Often appears near market tops.
NSE Example: Bank Nifty rallies to 49,500 (higher high) while MACD peaks lower — rally losing steam.
Critical Rule
Always wait for a confirming signal before acting on divergence. Ensure divergence is backed by adequate volume. Divergence without volume confirmation has much lower success rate.
Best MACD Trading Strategy for NSE Traders
📋 Entry Conditions (Long)
- Price must be trading above the 200 EMA (uptrend confirmed)
- MACD line crosses above Signal line
- Crossover occurs near or above zero line
- Volume above 20-period average on crossover candle
- Enter at close of crossover candle
📋 Exit & Risk Management
- Stop Loss: Below most recent swing low
- Target 1: 1:1 RR (book 50%)
- Target 2: 1:2 RR (trail remaining with MACD)
- Exit: When MACD gives bearish crossover
- Position Size: Risk max 1-2% capital per trade
MACD with Other Indicators
| Combination | Use Case | How It Works | Best For |
|---|---|---|---|
| MACD + RSI | Momentum | Crossover + RSI 40-60 zone confirms entry | Swing Trading |
| MACD + VWAP | Intraday | Buy signal + price above VWAP = long | Intraday |
| MACD + Bollinger | Breakout | Crossover near BB squeeze confirms breakout | Breakout |
| MACD + Price Action | Confirmation | Confirms candlestick patterns | All Timeframes |
| MACD + Volume | Validation | Above-avg volume confirms signal | All Styles |
MACD for Nifty and Bank Nifty Trading
📊 Index Trading
Use MACD on 15-min or hourly charts for Nifty/Bank Nifty futures. Default 12,26,9 works best. With Nifty trading around 23,000-24,000, daily MACD crossovers provide reliable directional signals.
📈 Options Trading
Use MACD on 15-min chart to time directional option buys. Bullish crossover near support → buy calls. Bearish crossover near resistance → buy puts. Always check IV before entering.
⚡ Weekly Expiry
For weekly expiry, use 5-min chart with 5,13,1 settings. Be cautious of theta decay — avoid holding long options based solely on MACD within last 2 hours before expiry.
🕐 Intraday
Combine MACD with VWAP and 200 EMA on 5 or 15-min chart. Only take MACD buys when price is above VWAP and 200 EMA. Triple-filter reduces false signals during volatile hours.
MACD for Stock Trading
Large-Cap Stocks
Reliance, TCS, HDFC Bank — use default settings on daily charts. Signals are reliable due to high liquidity. Best for swing and positional trading.
Mid-Cap Stocks
More volatile MACD patterns. Use slightly slower settings (14,30,9) to filter noise. Always confirm with volume and sector trend.
Momentum Stocks
High-beta stocks respond to faster settings (8,17,9). Clear histogram expansions before major moves. Ideal for short-term F&O plays.
MACD Success Rate
No indicator provides guaranteed accuracy. Here are approximate observed performance ranges:
Market Condition Dependency
These rates are approximate. MACD performs best in trending markets and underperforms in sideways markets. During high-volatility events (RBI policy, Budget, elections), signals can be unreliable.
MACD Signals to Ignore
❌ Sideways Market Crossovers
In narrow range markets, MACD produces multiple crossovers leading nowhere. Histogram stays small and choppy. Avoid when 20-period ATR is below average.
❌ Multiple Crossovers in Small Range
3-4 crossovers with MACD hovering near zero = market indecisive. Wait for clear break away from zero.
❌ Divergence Without Volume
Divergence without above-average volume has low predictive value. Low-volume divergences on mid/small-cap NSE stocks are unreliable.
❌ Signal Against Higher Timeframe
A 5-min buy signal while daily MACD is bearish is low-probability. Always align with higher timeframe trend.
❌ Expiry Day Noise
On weekly expiry days, MACD signals become unreliable due to gamma-driven swings and abnormal volume patterns.
❌ News Event Volatility
News-driven MACD signals often reverse. Wait for dust to settle before acting on post-event crossovers.
❌ Low Volume / Illiquid Stocks
MACD fails on low-volume stocks. Stick to stocks with daily volume above 5 lakh shares on NSE.
Common Mistakes Traders Make
🚫 Entering Too Early
Many traders enter before the crossover candle closes. Always wait for candle close to confirm signal.
🚫 Ignoring the Trend
Taking MACD buys in a clear downtrend = losses. Confirm broader trend using 200 EMA or higher timeframe.
🚫 Ignoring Volume
Crossover without volume = weak signal. Volume validates strength behind any movement.
🚫 Overtrading Crossovers
Acting on every crossover = death by thousand cuts. Be selective — trade only highest conviction setups.
Advantages of MACD
✅ Easy to Understand
Simple visual interpretation — crossovers, histogram, zero line make it beginner-friendly.
✅ Dual Function
Combines trend-following and momentum analysis in a single indicator.
✅ All Timeframes
Effective on 1-minute to weekly charts — versatile for all trading styles.
✅ Available Everywhere
Built into TradingView, Zerodha Kite, Upstox, Angel One, MetaTrader.
✅ Divergence Detection
Excellent at identifying divergences preceding major reversals.
✅ Customizable
Settings adjustable for faster or slower signals matching any style.
Limitations of MACD
⚠️ Lagging Indicator
Based on moving averages, signals come after the move has started.
⚠️ Poor in Sideways Markets
Generates numerous false crossovers during range-bound conditions.
⚠️ No OB/OS Levels
Unlike RSI, has no fixed overbought/oversold boundaries.
⚠️ False Divergences
Not all divergences lead to reversals — some persist for weeks.
⚠️ Needs Confirmation
Moderate success rate alone — requires volume, price action, or other indicators.
⚠️ Whipsaws
High-volatility events cause rapid alternating signals and repeated stop hits.
Complete MACD Trading Checklist
MACD Trading Example
📊 Example: Long Trade on Reliance Industries (NSE)
Chart Setup: Daily chart with MACD (12, 26, 9) and 200 EMA
Outcome: Price moved to ₹2,620 in 8 sessions. T1 hit. Remaining trailed until bearish crossover at ₹2,595. Profit: ₹145-170/share.
MACD vs RSI vs Moving Average vs Supertrend
MACD vs RSI
| Feature | MACD | RSI |
|---|---|---|
| Type | Trend + Momentum | Momentum Oscillator |
| Range | Unbounded (around zero) | 0 to 100 |
| OB/OS Levels | No fixed levels | 70/30 standard |
| Best Use | Trend direction & entries | OB/OS conditions |
| Divergence | Excellent | Good |
| Best Market | Trending | Range-bound & trending |
| Combined | Together = momentum + trend + OB/OS analysis | |
MACD vs Moving Average
| Feature | MACD | Moving Average |
|---|---|---|
| Type | Oscillator (separate panel) | Overlay (on chart) |
| Shows | Momentum + trend strength | Trend + support/resistance |
| Histogram | Yes | No |
| Divergence | Can detect | Cannot detect |
| Best Combo | MAs for trend direction + MACD for entry/exit timing | |
MACD vs Supertrend
| Feature | MACD | Supertrend |
|---|---|---|
| Type | Oscillator | Overlay (trend-following) |
| Basis | EMA convergence | ATR based |
| Signal Clarity | Requires interpretation | Very clear (green/red) |
| Stop Loss | Not built-in | Built-in via ST line |
| Momentum | Via histogram | None |
| Best Combo | Supertrend for direction + trailing stop, MACD for entry timing | |
Frequently Asked Questions
Conclusion
The MACD indicator remains one of the most powerful, versatile, and reliable tools in a trader's technical analysis toolkit. Whether you are an intraday trader, swing trader, or options trader on the NSE, MACD provides invaluable insights into trend direction, momentum strength, and potential reversal points.
🎯 Key Takeaways
- MACD combines trend and momentum — a dual-purpose tool reducing chart clutter
- Default settings (12, 26, 9) remain the most reliable for most NSE trading scenarios
- Always filter signals with trend direction (200 EMA), volume, and price action
- Divergence analysis is MACD's most powerful feature for reversal trades
- Avoid MACD in sideways markets — excessive false signals
- Risk management is non-negotiable — always use stop losses and proper position sizing
- Combining MACD with RSI, VWAP, or Supertrend significantly improves results
- Practice on paper trading before deploying with real capital
The key to successful trading is not finding a perfect indicator — it is using reliable tools like MACD consistently, with proper risk management, emotional discipline, and continuous learning.
Continue Learning with Option Matrix India
This guide is part of our Technical Analysis Education Series. Explore our guides on RSI, Supertrend, Bollinger Bands, VWAP, and Price Action to build a complete trading system.
⚠️ Important Disclaimer
This article is for educational and informational purposes only. It does not constitute financial advice, investment recommendations, or trading signals. Trading in stocks, futures, and options involves substantial risk of loss.
Past performance of any indicator, including MACD, does not guarantee future results. Success rates mentioned are approximate estimates — actual results vary based on market conditions and individual execution.
Always do your own research (DYOR) before making trading decisions. Consult a SEBI-registered financial advisor for personalized advice. Option Matrix India shall not be held responsible for any trading losses.
Stock market investments are subject to market risks. Please read all scheme-related documents carefully before investing.