
What is VWAP Indicator? Complete VWAP Trading Strategy Guide
Master the Volume Weighted Average Price indicator — the most powerful institutional benchmark used by professional traders in the Indian stock market. Learn VWAP strategies, volume analysis, and real trading setups.
 Candlestick Charts
 Volume Analysis
 Trader Workspace
📑 Table of Contents
- What is VWAP Indicator?
- Why VWAP is Important in Trading
- How VWAP Works
- How To Add VWAP in TradingView
- How To Trade Using VWAP
- VWAP Trading Strategies
- VWAP + Volume Analysis
- Volume Types Traders Should Ignore
- VWAP Vs Moving Average
- VWAP For Nifty & Bank Nifty Traders
- Common VWAP Mistakes
- Best Indicator Combinations With VWAP
- Real Trading Examples
- Advantages & Limitations
- Frequently Asked Questions
- Latest NSE Market Perspective
- Conclusion
If you are an active trader in the Indian stock market, you've likely come across the term VWAP — an indicator that institutional desks, algorithmic trading systems, and professional day traders rely on every single trading session. Understanding VWAP is not just about adding another line to your chart. It's about understanding where the real money is trading and aligning your strategy with institutional flow.
In this comprehensive guide, we will break down everything you need to know about the VWAP indicator — from its mathematical formula and calculation to advanced trading strategies, volume analysis, common mistakes, and real-world examples from the NSE market. Whether you trade Nifty 50, Bank Nifty, stock futures, or options, this guide will transform how you interpret price and volume on your charts.
What is VWAP Indicator?
VWAP stands for Volume Weighted Average Price. It is a trading benchmark that calculates the average price at which a security has been traded throughout the trading day, weighted by volume. Unlike a simple moving average that only considers closing prices, VWAP incorporates both price and volume, making it a far more accurate representation of the true average price paid by market participants.
Think of VWAP as the "fair value" of a stock for the current trading session. If you are buying above VWAP, you are paying more than what the average market participant has paid. If you are buying below VWAP, you are getting a relative discount. This simple yet profound concept is why institutional traders worldwide — including those on Dalal Street — use VWAP as their primary execution benchmark.
VWAP was originally developed for institutional traders who needed to execute large orders without significantly impacting the market. By breaking their orders into smaller pieces and executing them at or near VWAP, institutions could ensure they were buying or selling at a fair average price. Over time, retail traders recognized the power of this indicator and adopted it for intraday trading, scalping, and swing trading within the session.
The beauty of VWAP lies in its objectivity. It doesn't rely on arbitrary periods or lagging calculations. It is a cumulative measure that starts fresh at the beginning of each trading session, continuously updating as new price and volume data flows in. This makes it uniquely suited for intraday analysis on NSE and BSE markets.
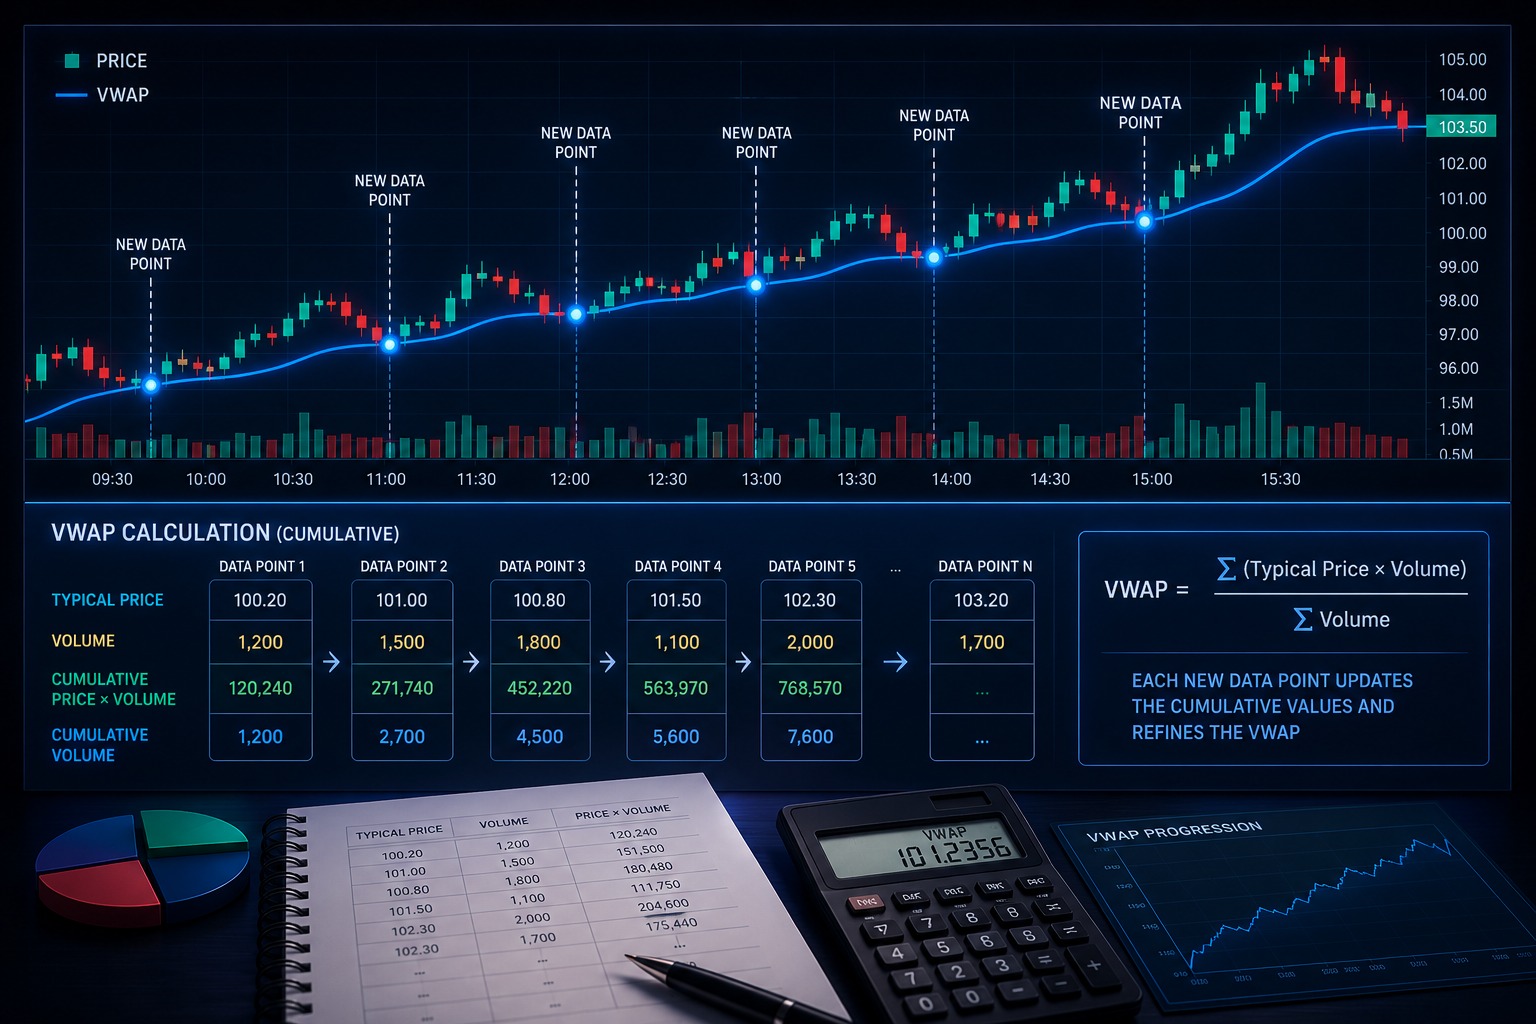
The formula is straightforward but powerful. For each time period (candle), you multiply the typical price (the average of high, low, and close) by the volume traded during that period. You then sum all these values from the start of the session and divide by the total cumulative volume. The result is a single line on your chart that represents the volume-weighted fair value of the security.
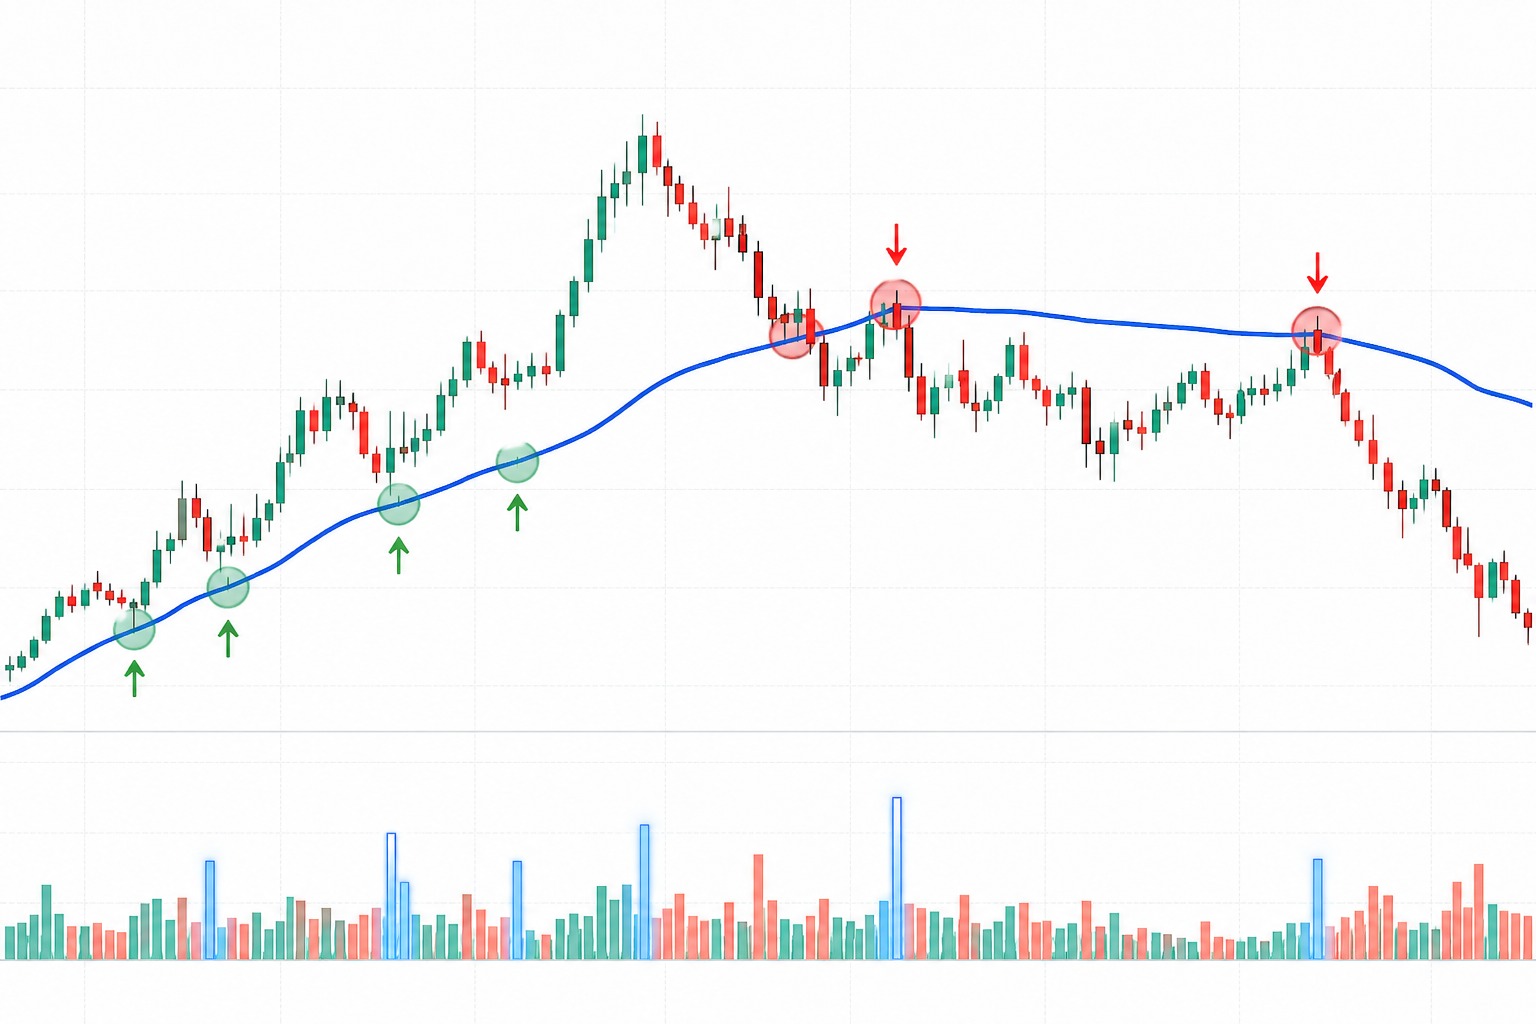
Why Institutions Use VWAP
Institutional traders — mutual funds, hedge funds, proprietary desks, and foreign institutional investors (FIIs) — manage enormous capital. When they buy or sell, the sheer size of their orders can move the market. VWAP serves as their benchmark because it represents the "fair execution price" for the session. If an institution's average buy price is below VWAP, they have executed well. If above VWAP, they've overpaid. This is why large algorithmic trading systems are often designed to execute orders at or near VWAP.
Why Retail Traders Use VWAP
For retail traders, VWAP offers several practical benefits. It acts as a dynamic support and resistance level that adapts to real-time market conditions. It helps identify the prevailing intraday trend — bullish above VWAP, bearish below. It provides objective entry and exit points. And perhaps most importantly, it allows retail traders to align their trades with institutional flow. When you buy above VWAP and the price continues higher, you know you're trading with institutional money, not against it.
Why VWAP is Important in Trading
VWAP isn't just another indicator on your chart — it's a fundamental tool that bridges the gap between institutional and retail trading. Understanding why VWAP matters will help you appreciate its power and use it more effectively in your trading decisions.
The confluence of these factors makes VWAP one of the most versatile and reliable indicators available to modern traders. Whether you are scalping Nifty futures on a 1-minute chart or taking positional intraday trades in Bank Nifty options, VWAP provides the structural framework you need to make informed decisions. Professional trading desks in Mumbai, Delhi, and across India consider VWAP an indispensable tool in their daily workflow.
How VWAP Works
Understanding how VWAP is calculated step by step will give you deeper insight into why the indicator behaves the way it does. Let's walk through a practical example using a hypothetical stock on a 15-minute intraday chart.
Step-by-Step VWAP Calculation
For each candle, we first calculate the Typical Price — the average of the high, low, and close. We then multiply this by the volume for that candle. Finally, we take the cumulative sum of these products and divide by the cumulative volume.
| Time | High (₹) | Low (₹) | Close (₹) | Typical Price (₹) | Volume | TP × Volume | Cum TP×V | Cum Volume | VWAP (₹) |
|---|---|---|---|---|---|---|---|---|---|
| 09:15 | 252 | 248 | 250 | 250.00 | 10,000 | 25,00,000 | 25,00,000 | 10,000 | 250.00 |
| 09:30 | 254 | 250 | 252 | 252.00 | 12,000 | 30,24,000 | 55,24,000 | 22,000 | 251.09 |
| 09:45 | 253 | 249 | 251 | 251.00 | 15,000 | 37,65,000 | 92,89,000 | 37,000 | 251.05 |
| 10:00 | 256 | 252 | 255 | 254.33 | 20,000 | 50,86,667 | 1,43,75,667 | 57,000 | 252.20 |
The calculation reveals an important characteristic: VWAP gives more weight to periods with higher volume. If a stock trades heavily at ₹255, that price level will have a stronger pull on VWAP than a low-volume period at ₹250. This volume-weighting is what makes VWAP superior to simple price averages for intraday trading.
How To Add VWAP Indicator In TradingView
TradingView is one of the most popular charting platforms used by Indian traders. Adding VWAP to your chart is simple and takes less than a minute. Here's a step-by-step guide:
Navigate to TradingView and open any stock or index chart. For NSE stocks, type the symbol (e.g., NIFTY, BANKNIFTY, RELIANCE) in the search bar. Select the appropriate exchange (NSE). Switch to an intraday timeframe — 5-minute or 15-minute charts work best with VWAP.
Click on the "Indicators" button at the top of your chart (it looks like a wave icon or fx symbol). Alternatively, you can press the forward slash (/) key on your keyboard to quickly access the indicator search. This opens the indicator library where thousands of technical indicators are available.
In the search bar, type "VWAP" and you will see several results. Select "VWAP" from the built-in indicators (usually the first result). TradingView's built-in VWAP uses the standard calculation with typical price and session reset. You can also find anchored VWAP variations in the community scripts section.
Once applied, the VWAP line will appear on your chart as a blue line (default color). You can customize the appearance by double-clicking the indicator — change the line color, thickness, and style. You can also enable VWAP bands (standard deviation bands) which act as dynamic support and resistance zones. The upper band acts as resistance while the lower band provides support. Save your chart layout for future sessions.
How To Trade Using VWAP
VWAP provides multiple trading setups that can be adapted to different market conditions. Below are the six primary setups that professional traders use. Each setup includes entry logic, stop loss placement, target identification, and risk management guidelines.
VWAP Trading Strategies
Now let's dive deeper into five proven VWAP trading strategies that work consistently in the Indian stock market. Each strategy has been tested across Nifty, Bank Nifty, and high-liquidity NSE stocks.
VWAP Bounce Strategy
The VWAP Bounce is one of the most reliable intraday strategies. It works on the principle that VWAP acts as dynamic support in an uptrend and dynamic resistance in a downtrend. When price pulls back to VWAP and bounces, it often resumes the original trend with conviction.
How to trade: Wait for price to establish a clear trend direction (above or below VWAP). When price pulls back to touch VWAP, look for a reversal candlestick pattern — hammer, bullish engulfing, or pin bar for longs. Enter on the close of the reversal candle with stop loss below VWAP. Target the previous swing high or a 1:2 risk-reward ratio. Volume should decrease during the pullback and increase on the bounce — this confirms genuine institutional re-entry.
Best timeframe: 5-minute and 15-minute charts. Works exceptionally well during the first two hours of trading (9:15 AM to 11:15 AM IST) when volume is highest.
VWAP Breakout Strategy
The VWAP Breakout strategy captures the explosive move when price decisively breaks through VWAP after a period of consolidation. This typically occurs when major participants enter the market, creating a strong directional move.
How to trade: Identify periods where price is consolidating near VWAP with decreasing volatility (narrowing candle ranges). Watch for a breakout candle that closes decisively above or below VWAP with volume at least 1.5 to 2 times the average. Enter on the breakout candle close. Place stop loss on the opposite side of VWAP. The first target should be at least 1:1.5 risk-reward. Use trailing stops for the remaining position.
Key filter: The breakout must occur with genuine volume. If volume is weak, the breakout is likely to fail — wait for volume confirmation before committing capital.
VWAP Pullback Strategy
This strategy is designed for trending markets where price moves away from VWAP and then retraces back, offering a lower-risk entry point. It is favored by traders who prefer entering trends at a discount rather than chasing breakouts.
How to trade: After a strong initial move away from VWAP (first 30-45 minutes of the session), wait for price to retrace back toward VWAP. The pullback should be orderly — small candles, declining volume, no panic selling. When price reaches within 0.1-0.3% of VWAP and shows signs of holding (support candle formation), enter in the direction of the original trend. Stop loss goes below the pullback low (for longs) or above pullback high (for shorts).
Risk consideration: Not every pullback to VWAP results in a bounce. If the pullback pierces VWAP and closes beyond it on heavy volume, the trend may be reversing — exit immediately.
VWAP Reversal Strategy
The VWAP Reversal strategy aims to catch trend reversals by identifying when the relationship between price and VWAP shifts fundamentally. This is a higher-risk, higher-reward approach best suited for experienced traders.
How to trade: When price has been trending below VWAP all session and suddenly crosses above with a strong volume spike, it signals potential reversal. Wait for the candle to close above VWAP — don't enter on the cross itself. Confirm with additional signals: RSI divergence, MACD crossover, or a strong reversal candle pattern. Enter on confirmation with stop loss below the reversal candle's low. Target is at least 1:2 risk-reward with trailing stops.
Warning: VWAP reversals often produce false signals during choppy, range-bound markets. Use this strategy only when you see a clear change in volume character and momentum.
VWAP With Price Action Strategy
This advanced strategy combines VWAP analysis with raw price action — no additional indicators needed. It relies on reading candlestick patterns, support/resistance levels, and market structure in conjunction with VWAP.
How to trade: Mark the opening range (first 15-30 minutes). Note where VWAP sits relative to this range. If price breaks above the opening range high AND is above VWAP, take longs. If price breaks below opening range low AND is below VWAP, take shorts. Use the opening range boundaries and VWAP as your framework for the entire session. Look for price action patterns (engulfing candles, inside bars, pin bars) at these key levels for precise entries.
Why it works: By combining the market structure information from price action with the volume-weighted fair value from VWAP, you create a powerful confluence of signals that significantly improves win rate and reward-to-risk ratios.
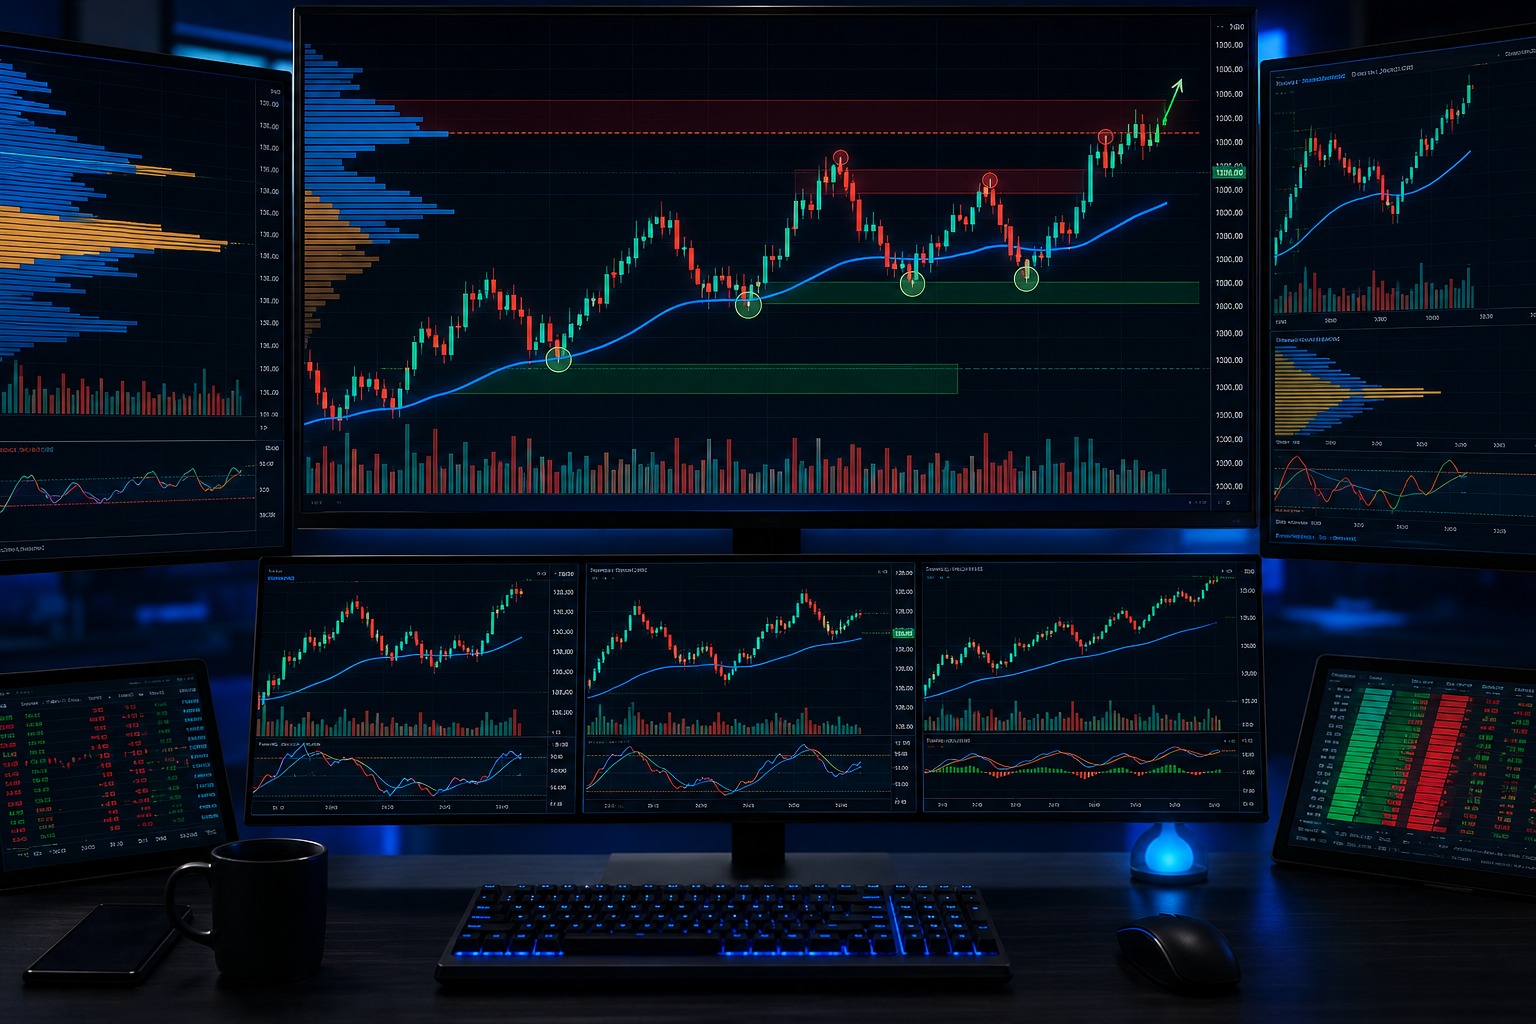
VWAP + Volume Analysis
VWAP and volume are intrinsically linked — after all, VWAP is a volume-weighted indicator. Understanding volume behavior in conjunction with VWAP dramatically improves your trading accuracy. Here's how different volume scenarios interact with VWAP signals:
The relationship between volume and VWAP cannot be overstated. A VWAP crossover without volume is like a car without fuel — it might move briefly but won't sustain the journey. Always confirm your VWAP signals with volume analysis before committing capital to a trade.
What Type of Volume Should Traders Ignore?
Not all volume is created equal. Smart traders know which volume signals to act on and which to ignore. Here are the volume types that can lead you astray when combined with VWAP analysis — particularly relevant for NSE traders:
Extremely Low Volume Candles
Candles with unusually low volume provide no meaningful information. VWAP crossovers on such candles are unreliable because they represent participation from very few market participants. On NSE, look for volume at least at the 20-period average before acting on a signal.
Lunch Hour Low Liquidity (12:00 PM – 1:30 PM IST)
The lunch hour on NSE typically sees a significant drop in volume and liquidity. VWAP crossovers during this period are often noise. Many experienced Indian traders avoid taking new positions during this window and wait for the afternoon session to resume activity.
Random Retail Volume
Scattered, inconsistent volume from small retail orders doesn't carry directional conviction. Look for concentrated volume bursts — these are more likely institutional orders that will sustain the VWAP signal's direction.
News Spike Without Follow-through
When unexpected news hits the market, you may see a massive volume spike and a VWAP crossover. However, if follow-through volume dries up immediately after the spike, the move is likely to reverse. Wait for sustained volume before acting on news-driven VWAP breaks.
Fake Breakouts on Low Participation
Stocks that show VWAP breakouts on thin participation often get sucked back. This is especially common in mid-cap and small-cap stocks on NSE where a single large order can temporarily push price through VWAP without genuine institutional interest.
Low Participation Stocks
Stocks with average daily volume below 5 lakh shares (or equivalent in value terms) may not provide reliable VWAP signals. VWAP works best with high-liquidity instruments where large institutional orders interact with the market continuously throughout the day.
Expiry Day Noise (Weekly/Monthly Options Expiry)
On Nifty and Bank Nifty weekly expiry days (every Thursday), options-related activity creates artificial volume patterns. Gamma hedging, delta adjustments, and option seller covering create volume that doesn't reflect genuine directional conviction. Be extra cautious with VWAP signals on expiry days.
Manipulated Penny Stocks
Penny stocks and low-float stocks on NSE are susceptible to operator manipulation. Volume spikes and VWAP crossovers in such stocks are often manufactured to attract retail traders before the operators dump their holdings. Stick to Nifty 200 or higher-quality stocks for VWAP-based trading.
VWAP Vs Moving Average
Many traders wonder how VWAP compares to traditional moving averages like EMA and SMA. While all three are trend-following tools, they differ significantly in calculation, application, and effectiveness. Here's a detailed comparison:
| Feature | VWAP | EMA (Exponential Moving Average) | SMA (Simple Moving Average) |
|---|---|---|---|
| Calculation | Cumulative price × volume ÷ cumulative volume | Weighted average of recent closing prices | Simple average of closing prices over N periods |
| Volume Included | ✅ Yes — core component | ❌ No — purely price-based | ❌ No — purely price-based |
| Intraday Use | ✅ Excellent — designed for intraday | ✅ Good — works on all timeframes | ⚠️ Decent — can be laggy intraday |
| Swing/Positional Use | ⚠️ Limited — resets daily | ✅ Excellent — multi-day analysis | ✅ Good — multi-day trend identification |
| Accuracy | ✅ High — reflects actual traded values | ✅ Good — responsive to recent price | ⚠️ Moderate — treats all data equally |
| Institutional Usage | ✅ Primary benchmark | ⚠️ Supplementary tool | ⚠️ Basic reference |
| Best Market Condition | Trending intraday markets with good volume | Trending markets on any timeframe | Identifying long-term trend direction |
| Reset Behavior | Resets at market open each day | Continuous — no reset | Continuous — no reset |
| Lag | Minimal in morning, increases through day | Low to moderate depending on period | Moderate to high depending on period |
VWAP For Nifty and Bank Nifty Traders
VWAP is extensively used by professional traders who actively trade Indian benchmark indices. Here's how different types of traders apply VWAP across various instruments:
How Option Traders Use VWAP
Options traders on NIFTY 50, BANK NIFTY, FINNIFTY, and MIDCAP NIFTY use the underlying futures VWAP to make directional decisions. When the underlying index crosses above VWAP with volume, call option premiums tend to increase and put premiums decrease. Traders use this as a trigger to buy calls or sell puts. Conversely, a VWAP breakdown in the underlying is a signal to buy puts or sell calls. The key advantage is that VWAP on the underlying filters out much of the options-specific noise, providing cleaner directional signals for options strategies.
How Futures Traders Use VWAP
Futures traders on Nifty and Bank Nifty use VWAP as their primary directional filter. The rule is straightforward: take only long trades when the futures are above VWAP and only short trades when below. This single filter eliminates many losing trades by ensuring you're aligned with the dominant flow. Futures traders also use VWAP as a dynamic stop loss — if their long position sees the futures close below VWAP, they exit regardless of other indicators.
How Scalpers Use VWAP
Scalpers trading NIFTY and BANK NIFTY on 1-minute and 3-minute charts use VWAP as a quick-reference bias tool. If price is above VWAP, they only look for quick long scalps. If below, they only scalp the short side. The proximity of price to VWAP also helps scalpers identify low-risk entry points — the closer price is to VWAP, the tighter the stop loss can be. Scalpers particularly benefit from VWAP during the opening 90 minutes when volatility and volume are peak.
How Institutional Desks Use VWAP
Institutional trading desks at major Indian brokerages and fund houses use VWAP algorithms to execute large orders. When a fund needs to buy or sell a large block of Nifty futures or constituent stocks, they deploy VWAP execution algorithms that spread the order throughout the day, aiming to achieve an average execution price at or near the session's VWAP. This minimizes market impact and provides a fair benchmark for execution quality. Understanding this institutional behavior helps retail traders anticipate how large orders will influence VWAP-related price levels.
⚠️ Important Note: Always verify current market data from NSE India before taking trades. Market conditions change daily. The examples and concepts discussed are educational — past patterns do not guarantee future results. Indices like NIFTY 50, BANK NIFTY, FINNIFTY, and MIDCAP NIFTY have unique volatility characteristics that should be factored into your VWAP analysis.
Common VWAP Mistakes
Even experienced traders make critical errors when using VWAP. Recognizing and avoiding these mistakes can significantly improve your trading performance and protect your capital:
One of the biggest mistakes is going long when price is consistently below VWAP or shorting when it's above. VWAP represents the path of least resistance. Fighting it means fighting institutional flow. Always align your trades with VWAP direction.
VWAP without volume context is incomplete analysis. A VWAP crossover on low volume is significantly less reliable than one on high volume. Always check volume bars before acting on a VWAP signal — it's the difference between conviction and wishful thinking.
VWAP provides intraday bias, but ignoring the broader trend (daily, weekly) can lead to losses. If the daily chart shows a strong downtrend, bullish VWAP signals on the intraday chart may be mere pullbacks in the larger bear trend. Always check higher timeframes.
In choppy, range-bound markets, price can cross VWAP multiple times in a single session. Taking every crossover as a trade signal leads to death by a thousand cuts. Develop filters (volume, candle pattern, time of day) to select only the highest-probability crosses.
While VWAP is powerful, relying on it as your only indicator removes important confirmation layers. The best traders combine VWAP with at least one additional confluence factor — support/resistance, candlestick patterns, RSI, or volume profile. This multi-factor approach dramatically improves accuracy.
Entering a VWAP trade after price has already moved significantly from VWAP defeats the purpose. The best risk-reward comes from entries near VWAP. If price is far from VWAP, either wait for a pullback or skip the trade entirely. Late entries lead to wide stops and poor risk-reward ratios.
This is a cardinal sin in any trading approach, but particularly dangerous with VWAP trading. When a VWAP signal fails, it can fail fast and hard. Always have a predetermined stop loss before entering any VWAP trade. A common approach is to place the stop just beyond VWAP on the opposite side of your trade.
Best Indicator Combinations With VWAP
VWAP works best when combined with complementary indicators that provide additional confirmation. Here are the six most effective indicator combinations for Indian market traders:
Setup: Use RSI (14) as a momentum filter alongside VWAP. When price is above VWAP and RSI is between 50-70, take longs. When price is below VWAP and RSI is between 30-50, take shorts. Avoid trades when RSI is in extreme overbought (>80) or oversold (<20) territory as reversals become more likely. RSI divergence near VWAP provides the highest-probability reversal signals.
Setup: MACD (12, 26, 9) confirms VWAP signals with momentum confirmation. A bullish VWAP cross combined with a MACD bullish crossover (MACD line crossing above signal line) is a powerful double confirmation. The histogram expansion after this dual signal indicates increasing momentum. This combination filters out many false VWAP signals in choppy markets.
Setup: Volume Profile shows where the most volume has been traded at specific price levels. When VWAP aligns with a high-volume node (HVN) on the Volume Profile, it creates an extremely strong support or resistance zone. These confluence zones are institutional battlegrounds where significant buying or selling is likely to occur. This combination is considered one of the most advanced and effective for professional traders.
Setup: For Nifty and Bank Nifty traders, combining VWAP with open interest analysis provides market microstructure insights. Rising OI with price above VWAP indicates long buildup — bullish. Rising OI with price below VWAP indicates short buildup — bearish. Falling OI with VWAP crossover suggests short covering or long unwinding, which requires different trade management.
Setup: Pure price action patterns at VWAP create the cleanest trading signals. Look for hammer, engulfing, pin bar, inside bar, and morning/evening star patterns at VWAP levels. A bullish engulfing candle at VWAP support is one of the highest-conviction buy signals in intraday trading. This approach requires no additional indicators — just VWAP and candlestick reading skills.
Setup: This is particularly powerful for NSE index traders. Analyze the option chain for maximum pain, PCR (put-call ratio), and key OI changes at strike prices. When VWAP suggests a bullish bias and the option chain shows put writing at support levels, the dual confirmation provides high-confidence directional trades. Heavy call writing above current price combined with bearish VWAP signals confirms resistance.
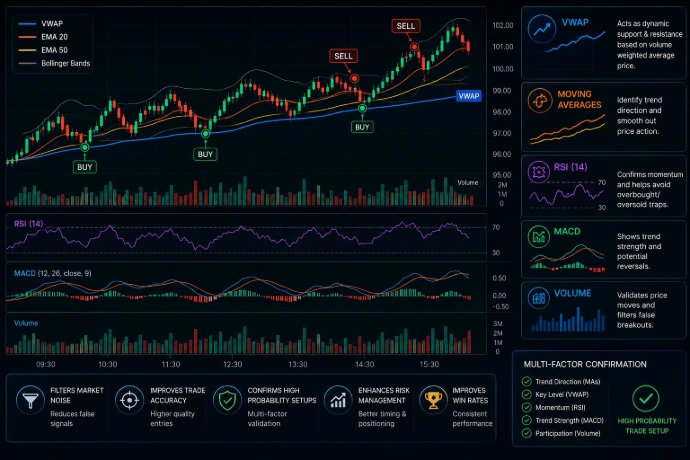
Real Trading Examples
Let's examine three practical trading case studies that demonstrate how VWAP setups play out in real market conditions. These are representative examples based on common patterns seen in NSE trading sessions:
Advantages and Limitations of VWAP
Like every indicator, VWAP has its strengths and weaknesses. Understanding both will help you deploy it effectively and avoid situations where it may lead you astray:
✅ Advantages
- Provides exceptional trend clarity for intraday traders — above VWAP = bullish, below = bearish
- Serves as the primary institutional benchmark for execution quality measurement
- Acts as strong dynamic support and resistance that adapts to real-time market conditions
- Incorporates volume in calculation, making it more accurate than price-only indicators
- Works across all liquid instruments — stocks, futures, indices, and ETFs
- Simple to interpret — even beginner traders can use the basic concept effectively
- Helps identify fair value of a security during the trading session
- Reduces emotional trading by providing objective reference points
- Available for free on virtually all modern charting platforms
- Excellent for confirming other technical signals — adds confluence to any trading system
⚠️ Limitations
- Becomes increasingly lagging as the trading session progresses due to cumulative calculation
- Primarily an intraday indicator — resets daily, limiting its use for swing trading
- Less effective during news-driven events where volume is distorted by panic or euphoria
- Can produce multiple false crossover signals in choppy, range-bound markets
- Not useful for low-liquidity stocks where volume is insufficient for meaningful analysis
- Does not account for after-hours activity, gap openings, or pre-market trends
- Requires additional confirmation — shouldn't be used as a standalone trading system
- VWAP bands may differ across platforms depending on standard deviation settings
- Flattens in the afternoon, providing less actionable information in the last 90 minutes
Frequently Asked Questions
Here are the most commonly asked questions about VWAP indicator, answered in detail for Indian stock market traders:
VWAP stands for Volume Weighted Average Price. It is a technical analysis indicator that calculates the average price a security has traded at throughout the day, weighted by volume. It provides a benchmark that reflects the true average price paid by all market participants during the current trading session. VWAP is displayed as a single line on intraday charts and is one of the most important tools used by institutional and retail traders alike.
Yes, VWAP is one of the most effective indicators for intraday trading. It helps traders identify the fair value of a stock during the trading session and determine whether they are buying at a premium or discount relative to the day's average traded price. Its volume-weighted nature makes it especially valuable for confirming the strength of intraday moves and identifying high-probability entry and exit points. Most professional intraday traders consider VWAP an essential tool.
Yes, VWAP can be applied to the underlying asset (like Nifty or Bank Nifty futures) to make options trading decisions. When the underlying crosses above VWAP with volume, traders may consider buying call options or selling put options. When it falls below VWAP, put options may be purchased or calls may be sold. The key is to apply VWAP to the underlying instrument, not the option itself, as option prices are influenced by many factors beyond just direction.
VWAP and EMA serve different purposes and neither is universally "better." VWAP incorporates volume in its calculation, making it superior for intraday trading and institutional benchmarking. EMA is purely price-based and works better for swing trading, positional trading, and multi-day trend analysis. For intraday trading on NSE, VWAP is generally preferred by professional traders. Many use both — VWAP for intraday and EMA for higher timeframe context.
VWAP is highly accurate as an intraday benchmark because it factors in both price and volume. However, its accuracy depends on the liquidity of the stock. Highly liquid stocks like Nifty 50 components and Bank Nifty provide more reliable VWAP signals than low-volume penny stocks. VWAP is most accurate during the first half of the trading session when volume data is fresh and meaningful. In the afternoon, its accuracy as a trading signal diminishes as it flattens.
VWAP is primarily designed for intraday timeframes. The most popular timeframes are 1-minute, 3-minute, 5-minute, and 15-minute charts. For scalping, 1-3 minute charts work best as they provide more granular data. For swing intraday trades, 5-15 minute charts are ideal as they filter out minor noise while still providing timely signals. The VWAP calculation itself is the same regardless of the chart timeframe — only your view of price action relative to VWAP changes.
Yes, the standard VWAP resets at the beginning of each trading session. On NSE, this means it resets at 9:15 AM IST every trading day. This daily reset makes VWAP a purely intraday indicator. However, anchored VWAP (available on platforms like TradingView) can be set from any specific date, time, or event and does not reset automatically — this variant is useful for multi-day analysis.
Institutional traders use VWAP as a benchmark to evaluate their execution quality. They aim to buy below VWAP and sell above VWAP. Many institutional algorithms are designed to execute large orders at or near VWAP to minimize market impact. Fund managers evaluate their dealers' performance based on whether they achieved prices better or worse than VWAP. This makes VWAP the single most important reference price in institutional trading.
Absolutely. VWAP is extremely popular among Bank Nifty traders, especially for futures and options scalping. Bank Nifty's high liquidity and volatility make VWAP an excellent tool for identifying intraday support, resistance, and trend direction. Many full-time traders use VWAP as their primary indicator for Bank Nifty scalping, combined with price action and volume analysis for confirmation.
VWAP (Volume Weighted Average Price) weights price by volume, giving more importance to prices where heavy trading occurred. TWAP (Time Weighted Average Price) simply averages the price over equal time intervals regardless of volume. VWAP is generally more useful for active traders because it reflects where real money exchanged hands. TWAP is simpler but less informative. Most professional traders prefer VWAP over TWAP for its superior accuracy.
No, VWAP should not be used in isolation. It is most effective when combined with other indicators like RSI, MACD, Volume Profile, Price Action patterns, and Open Interest analysis. Using VWAP as part of a comprehensive trading system yields the best results. Think of VWAP as the foundation of your analysis — it provides directional bias, but you need additional tools for timing entries, managing risk, and confirming signal quality.
When the price is above VWAP, it indicates that the current price is higher than the average price paid by all participants, suggesting bullish sentiment. Buyers are in control and the stock is trading at a premium to its volume-weighted fair value. In this condition, long trades have a higher probability of success and short trades carry more risk. VWAP acts as dynamic support below the price.
Yes, VWAP is one of the most beginner-friendly indicators. Its core concept is straightforward — price above VWAP suggests bullish bias, price below suggests bearish bias. Beginners should start by simply observing how price interacts with VWAP across different stocks and indices. Practice on paper trades before committing real capital. As you gain experience, gradually add volume analysis and complementary indicators to build a complete trading system.
When the price is below VWAP, it means the stock is trading below the average price weighted by volume, indicating bearish sentiment. Sellers are dominant and the stock is at a discount relative to where most volume has traded. Short trades have higher probability in this zone. VWAP acts as dynamic resistance above the price. Buying in this zone is risky unless there are strong reversal signals with volume confirmation.
Yes, VWAP is available on most popular charting platforms including TradingView (free tier), Zerodha Kite, Upstox Pro, Angel One, Groww, and most other Indian broker platforms. It is a standard indicator built into the platform and does not require a premium subscription on most services. Some advanced variations like Anchored VWAP may require premium access on certain platforms.
Latest NSE Market Perspective
VWAP has become an integral part of modern Indian stock market trading. As market participation has grown and technology has advanced, VWAP's role has only become more prominent. Here's how VWAP is being used across different segments of the Indian market:
Index traders use VWAP on 5-minute and 15-minute charts to establish intraday directional bias. The high liquidity of Nifty and Sensex makes VWAP extremely reliable as a support/resistance tool. Algorithmic trading systems tracking Nifty use VWAP as a core component of their execution logic. FIIs and DIIs benchmark their index executions against VWAP daily.
Bank Nifty's high volatility and massive options market make VWAP a critical tool for both futures and options traders. Scalpers use VWAP on 1-3 minute charts for quick directional trades. Options sellers use VWAP on the underlying to decide strike selection and direction. The banking sector's concentration (few heavyweight stocks) makes VWAP particularly effective for Bank Nifty analysis.
Single stock futures traders use VWAP to confirm directional setups from other technical analysis. When a stock shows a bullish chart pattern and the futures price is above VWAP, it provides the confidence to enter with larger position sizes. VWAP combined with open interest data in stock futures provides powerful insights into whether smart money is building longs or shorts.
Advanced traders combine VWAP on the underlying with option chain data. When the underlying is above VWAP and the option chain shows heavy put writing at support levels, it confirms bullish bias. When the underlying is below VWAP with call writing above, it confirms bearish outlook. This synthesis of VWAP and options data creates a comprehensive market view that few retail traders utilize.
📋 Market conditions change daily. Traders should combine VWAP with current NSE price action, volume analysis, option chain data, and proper risk management. Never rely on a single indicator or past patterns for future trading decisions. Always verify current market data, check for corporate actions, and account for macro-economic events before placing trades. This article is for educational purposes only and does not constitute financial advice.

📚 Related Articles You May Like
- 📊 Complete Guide to RSI Indicator for Indian Traders
- 📈 MACD Trading Strategy — Nifty & Bank Nifty
- 🔢 Open Interest Analysis — NSE Options Trading
- 📉 Support & Resistance Trading Strategies
- 🕯️ Price Action Trading — Complete Beginner Guide
- 📊 Volume Profile Analysis for Indian Markets
- 💹 Option Chain Analysis — How to Read & Trade
- 📋 Risk Management for Indian Stock Traders
Conclusion
VWAP is more than just a line on your chart — it is a window into institutional thinking, a compass for intraday direction, and a framework for making disciplined trading decisions. Throughout this comprehensive guide, we've explored every facet of this remarkable indicator.
- VWAP is the Volume Weighted Average Price — the true average price at which a security trades during a session, weighted by volume
- It works because it incorporates volume, making it more accurate than price-only indicators and directly reflecting where real money has changed hands
- Institutions use it as their primary execution benchmark — understanding this helps retail traders align with smart money flow
- Retail traders benefit from VWAP as a dynamic support/resistance, trend filter, and objective entry/exit framework that removes emotional decision-making
- Multiple strategies — bounce, breakout, pullback, reversal, and price action — provide setups for every market condition
- Best combined with RSI, MACD, Volume Profile, Open Interest, and Price Action for the highest-probability trading system
- Risk management is paramount — always use stop losses, proper position sizing, and predetermined exit plans regardless of how strong the VWAP signal appears
- Practice first — paper trade VWAP strategies before deploying real capital. Understand the indicator's strengths and limitations in different market conditions
The journey from understanding VWAP to mastering it takes time, patience, and deliberate practice. Start by simply observing VWAP on your charts for a few weeks. Notice how price interacts with it — the bounces, breakdowns, and the role of volume in confirming or denying signals. Then gradually begin paper trading the setups described in this guide. Only when you are consistently profitable on paper should you transition to real capital with small position sizes.
Remember: no indicator is perfect, and VWAP is no exception. But when used correctly — with proper volume confirmation, complementary indicators, and disciplined risk management — VWAP can become the cornerstone of a profitable intraday trading system. The best traders in India and around the world use VWAP every single day. Now you have the knowledge to join them.
Trade smart. Manage risk. Let VWAP guide your way.
What is VWAP Indicator? Complete VWAP Trading Strategy Guide
Master the Volume Weighted Average Price indicator — the most powerful institutional benchmark used by professional traders in the Indian stock market. Learn VWAP strategies, volume analysis, and real trading setups.
Candlestick Charts
Volume Analysis
Trader Workspace
📑 Table of Contents
- What is VWAP Indicator?
- Why VWAP is Important in Trading
- How VWAP Works
- How To Add VWAP in TradingView
- How To Trade Using VWAP
- VWAP Trading Strategies
- VWAP + Volume Analysis
- Volume Types Traders Should Ignore
- VWAP Vs Moving Average
- VWAP For Nifty & Bank Nifty Traders
- Common VWAP Mistakes
- Best Indicator Combinations With VWAP
- Real Trading Examples
- Advantages & Limitations
- Frequently Asked Questions
- Latest NSE Market Perspective
- Conclusion
If you are an active trader in the Indian stock market, you've likely come across the term VWAP — an indicator that institutional desks, algorithmic trading systems, and professional day traders rely on every single trading session. Understanding VWAP is not just about adding another line to your chart. It's about understanding where the real money is trading and aligning your strategy with institutional flow.
In this comprehensive guide, we will break down everything you need to know about the VWAP indicator — from its mathematical formula and calculation to advanced trading strategies, volume analysis, common mistakes, and real-world examples from the NSE market. Whether you trade Nifty 50, Bank Nifty, stock futures, or options, this guide will transform how you interpret price and volume on your charts.
What is VWAP Indicator?
VWAP stands for Volume Weighted Average Price. It is a trading benchmark that calculates the average price at which a security has been traded throughout the trading day, weighted by volume. Unlike a simple moving average that only considers closing prices, VWAP incorporates both price and volume, making it a far more accurate representation of the true average price paid by market participants.
Think of VWAP as the "fair value" of a stock for the current trading session. If you are buying above VWAP, you are paying more than what the average market participant has paid. If you are buying below VWAP, you are getting a relative discount. This simple yet profound concept is why institutional traders worldwide — including those on Dalal Street — use VWAP as their primary execution benchmark.
VWAP was originally developed for institutional traders who needed to execute large orders without significantly impacting the market. By breaking their orders into smaller pieces and executing them at or near VWAP, institutions could ensure they were buying or selling at a fair average price. Over time, retail traders recognized the power of this indicator and adopted it for intraday trading, scalping, and swing trading within the session.
The beauty of VWAP lies in its objectivity. It doesn't rely on arbitrary periods or lagging calculations. It is a cumulative measure that starts fresh at the beginning of each trading session, continuously updating as new price and volume data flows in. This makes it uniquely suited for intraday analysis on NSE and BSE markets.
The formula is straightforward but powerful. For each time period (candle), you multiply the typical price (the average of high, low, and close) by the volume traded during that period. You then sum all these values from the start of the session and divide by the total cumulative volume. The result is a single line on your chart that represents the volume-weighted fair value of the security.
Why Institutions Use VWAP
Institutional traders — mutual funds, hedge funds, proprietary desks, and foreign institutional investors (FIIs) — manage enormous capital. When they buy or sell, the sheer size of their orders can move the market. VWAP serves as their benchmark because it represents the "fair execution price" for the session. If an institution's average buy price is below VWAP, they have executed well. If above VWAP, they've overpaid. This is why large algorithmic trading systems are often designed to execute orders at or near VWAP.
Why Retail Traders Use VWAP
For retail traders, VWAP offers several practical benefits. It acts as a dynamic support and resistance level that adapts to real-time market conditions. It helps identify the prevailing intraday trend — bullish above VWAP, bearish below. It provides objective entry and exit points. And perhaps most importantly, it allows retail traders to align their trades with institutional flow. When you buy above VWAP and the price continues higher, you know you're trading with institutional money, not against it.
Why VWAP is Important in Trading
VWAP isn't just another indicator on your chart — it's a fundamental tool that bridges the gap between institutional and retail trading. Understanding why VWAP matters will help you appreciate its power and use it more effectively in your trading decisions.
The confluence of these factors makes VWAP one of the most versatile and reliable indicators available to modern traders. Whether you are scalping Nifty futures on a 1-minute chart or taking positional intraday trades in Bank Nifty options, VWAP provides the structural framework you need to make informed decisions. Professional trading desks in Mumbai, Delhi, and across India consider VWAP an indispensable tool in their daily workflow.
How VWAP Works
Understanding how VWAP is calculated step by step will give you deeper insight into why the indicator behaves the way it does. Let's walk through a practical example using a hypothetical stock on a 15-minute intraday chart.
Step-by-Step VWAP Calculation
For each candle, we first calculate the Typical Price — the average of the high, low, and close. We then multiply this by the volume for that candle. Finally, we take the cumulative sum of these products and divide by the cumulative volume.
| Time | High (₹) | Low (₹) | Close (₹) | Typical Price (₹) | Volume | TP × Volume | Cum TP×V | Cum Volume | VWAP (₹) |
|---|---|---|---|---|---|---|---|---|---|
| 09:15 | 252 | 248 | 250 | 250.00 | 10,000 | 25,00,000 | 25,00,000 | 10,000 | 250.00 |
| 09:30 | 254 | 250 | 252 | 252.00 | 12,000 | 30,24,000 | 55,24,000 | 22,000 | 251.09 |
| 09:45 | 253 | 249 | 251 | 251.00 | 15,000 | 37,65,000 | 92,89,000 | 37,000 | 251.05 |
| 10:00 | 256 | 252 | 255 | 254.33 | 20,000 | 50,86,667 | 1,43,75,667 | 57,000 | 252.20 |
The calculation reveals an important characteristic: VWAP gives more weight to periods with higher volume. If a stock trades heavily at ₹255, that price level will have a stronger pull on VWAP than a low-volume period at ₹250. This volume-weighting is what makes VWAP superior to simple price averages for intraday trading.
How To Add VWAP Indicator In TradingView
TradingView is one of the most popular charting platforms used by Indian traders. Adding VWAP to your chart is simple and takes less than a minute. Here's a step-by-step guide:
Navigate to TradingView and open any stock or index chart. For NSE stocks, type the symbol (e.g., NIFTY, BANKNIFTY, RELIANCE) in the search bar. Select the appropriate exchange (NSE). Switch to an intraday timeframe — 5-minute or 15-minute charts work best with VWAP.
Click on the "Indicators" button at the top of your chart (it looks like a wave icon or fx symbol). Alternatively, you can press the forward slash (/) key on your keyboard to quickly access the indicator search. This opens the indicator library where thousands of technical indicators are available.
In the search bar, type "VWAP" and you will see several results. Select "VWAP" from the built-in indicators (usually the first result). TradingView's built-in VWAP uses the standard calculation with typical price and session reset. You can also find anchored VWAP variations in the community scripts section.
Once applied, the VWAP line will appear on your chart as a blue line (default color). You can customize the appearance by double-clicking the indicator — change the line color, thickness, and style. You can also enable VWAP bands (standard deviation bands) which act as dynamic support and resistance zones. The upper band acts as resistance while the lower band provides support. Save your chart layout for future sessions.
How To Trade Using VWAP
VWAP provides multiple trading setups that can be adapted to different market conditions. Below are the six primary setups that professional traders use. Each setup includes entry logic, stop loss placement, target identification, and risk management guidelines.
VWAP Trading Strategies
Now let's dive deeper into five proven VWAP trading strategies that work consistently in the Indian stock market. Each strategy has been tested across Nifty, Bank Nifty, and high-liquidity NSE stocks.
VWAP Bounce Strategy
The VWAP Bounce is one of the most reliable intraday strategies. It works on the principle that VWAP acts as dynamic support in an uptrend and dynamic resistance in a downtrend. When price pulls back to VWAP and bounces, it often resumes the original trend with conviction.
How to trade: Wait for price to establish a clear trend direction (above or below VWAP). When price pulls back to touch VWAP, look for a reversal candlestick pattern — hammer, bullish engulfing, or pin bar for longs. Enter on the close of the reversal candle with stop loss below VWAP. Target the previous swing high or a 1:2 risk-reward ratio. Volume should decrease during the pullback and increase on the bounce — this confirms genuine institutional re-entry.
Best timeframe: 5-minute and 15-minute charts. Works exceptionally well during the first two hours of trading (9:15 AM to 11:15 AM IST) when volume is highest.
VWAP Breakout Strategy
The VWAP Breakout strategy captures the explosive move when price decisively breaks through VWAP after a period of consolidation. This typically occurs when major participants enter the market, creating a strong directional move.
How to trade: Identify periods where price is consolidating near VWAP with decreasing volatility (narrowing candle ranges). Watch for a breakout candle that closes decisively above or below VWAP with volume at least 1.5 to 2 times the average. Enter on the breakout candle close. Place stop loss on the opposite side of VWAP. The first target should be at least 1:1.5 risk-reward. Use trailing stops for the remaining position.
Key filter: The breakout must occur with genuine volume. If volume is weak, the breakout is likely to fail — wait for volume confirmation before committing capital.
VWAP Pullback Strategy
This strategy is designed for trending markets where price moves away from VWAP and then retraces back, offering a lower-risk entry point. It is favored by traders who prefer entering trends at a discount rather than chasing breakouts.
How to trade: After a strong initial move away from VWAP (first 30-45 minutes of the session), wait for price to retrace back toward VWAP. The pullback should be orderly — small candles, declining volume, no panic selling. When price reaches within 0.1-0.3% of VWAP and shows signs of holding (support candle formation), enter in the direction of the original trend. Stop loss goes below the pullback low (for longs) or above pullback high (for shorts).
Risk consideration: Not every pullback to VWAP results in a bounce. If the pullback pierces VWAP and closes beyond it on heavy volume, the trend may be reversing — exit immediately.
VWAP Reversal Strategy
The VWAP Reversal strategy aims to catch trend reversals by identifying when the relationship between price and VWAP shifts fundamentally. This is a higher-risk, higher-reward approach best suited for experienced traders.
How to trade: When price has been trending below VWAP all session and suddenly crosses above with a strong volume spike, it signals potential reversal. Wait for the candle to close above VWAP — don't enter on the cross itself. Confirm with additional signals: RSI divergence, MACD crossover, or a strong reversal candle pattern. Enter on confirmation with stop loss below the reversal candle's low. Target is at least 1:2 risk-reward with trailing stops.
Warning: VWAP reversals often produce false signals during choppy, range-bound markets. Use this strategy only when you see a clear change in volume character and momentum.
VWAP With Price Action Strategy
This advanced strategy combines VWAP analysis with raw price action — no additional indicators needed. It relies on reading candlestick patterns, support/resistance levels, and market structure in conjunction with VWAP.
How to trade: Mark the opening range (first 15-30 minutes). Note where VWAP sits relative to this range. If price breaks above the opening range high AND is above VWAP, take longs. If price breaks below opening range low AND is below VWAP, take shorts. Use the opening range boundaries and VWAP as your framework for the entire session. Look for price action patterns (engulfing candles, inside bars, pin bars) at these key levels for precise entries.
Why it works: By combining the market structure information from price action with the volume-weighted fair value from VWAP, you create a powerful confluence of signals that significantly improves win rate and reward-to-risk ratios.
VWAP + Volume Analysis
VWAP and volume are intrinsically linked — after all, VWAP is a volume-weighted indicator. Understanding volume behavior in conjunction with VWAP dramatically improves your trading accuracy. Here's how different volume scenarios interact with VWAP signals:
The relationship between volume and VWAP cannot be overstated. A VWAP crossover without volume is like a car without fuel — it might move briefly but won't sustain the journey. Always confirm your VWAP signals with volume analysis before committing capital to a trade.
What Type of Volume Should Traders Ignore?
Not all volume is created equal. Smart traders know which volume signals to act on and which to ignore. Here are the volume types that can lead you astray when combined with VWAP analysis — particularly relevant for NSE traders:
Extremely Low Volume Candles
Candles with unusually low volume provide no meaningful information. VWAP crossovers on such candles are unreliable because they represent participation from very few market participants. On NSE, look for volume at least at the 20-period average before acting on a signal.
Lunch Hour Low Liquidity (12:00 PM – 1:30 PM IST)
The lunch hour on NSE typically sees a significant drop in volume and liquidity. VWAP crossovers during this period are often noise. Many experienced Indian traders avoid taking new positions during this window and wait for the afternoon session to resume activity.
Random Retail Volume
Scattered, inconsistent volume from small retail orders doesn't carry directional conviction. Look for concentrated volume bursts — these are more likely institutional orders that will sustain the VWAP signal's direction.
News Spike Without Follow-through
When unexpected news hits the market, you may see a massive volume spike and a VWAP crossover. However, if follow-through volume dries up immediately after the spike, the move is likely to reverse. Wait for sustained volume before acting on news-driven VWAP breaks.
Fake Breakouts on Low Participation
Stocks that show VWAP breakouts on thin participation often get sucked back. This is especially common in mid-cap and small-cap stocks on NSE where a single large order can temporarily push price through VWAP without genuine institutional interest.
Low Participation Stocks
Stocks with average daily volume below 5 lakh shares (or equivalent in value terms) may not provide reliable VWAP signals. VWAP works best with high-liquidity instruments where large institutional orders interact with the market continuously throughout the day.
Expiry Day Noise (Weekly/Monthly Options Expiry)
On Nifty and Bank Nifty weekly expiry days (every Thursday), options-related activity creates artificial volume patterns. Gamma hedging, delta adjustments, and option seller covering create volume that doesn't reflect genuine directional conviction. Be extra cautious with VWAP signals on expiry days.
Manipulated Penny Stocks
Penny stocks and low-float stocks on NSE are susceptible to operator manipulation. Volume spikes and VWAP crossovers in such stocks are often manufactured to attract retail traders before the operators dump their holdings. Stick to Nifty 200 or higher-quality stocks for VWAP-based trading.
VWAP Vs Moving Average
Many traders wonder how VWAP compares to traditional moving averages like EMA and SMA. While all three are trend-following tools, they differ significantly in calculation, application, and effectiveness. Here's a detailed comparison:
| Feature | VWAP | EMA (Exponential Moving Average) | SMA (Simple Moving Average) |
|---|---|---|---|
| Calculation | Cumulative price × volume ÷ cumulative volume | Weighted average of recent closing prices | Simple average of closing prices over N periods |
| Volume Included | ✅ Yes — core component | ❌ No — purely price-based | ❌ No — purely price-based |
| Intraday Use | ✅ Excellent — designed for intraday | ✅ Good — works on all timeframes | ⚠️ Decent — can be laggy intraday |
| Swing/Positional Use | ⚠️ Limited — resets daily | ✅ Excellent — multi-day analysis | ✅ Good — multi-day trend identification |
| Accuracy | ✅ High — reflects actual traded values | ✅ Good — responsive to recent price | ⚠️ Moderate — treats all data equally |
| Institutional Usage | ✅ Primary benchmark | ⚠️ Supplementary tool | ⚠️ Basic reference |
| Best Market Condition | Trending intraday markets with good volume | Trending markets on any timeframe | Identifying long-term trend direction |
| Reset Behavior | Resets at market open each day | Continuous — no reset | Continuous — no reset |
| Lag | Minimal in morning, increases through day | Low to moderate depending on period | Moderate to high depending on period |
VWAP For Nifty and Bank Nifty Traders
VWAP is extensively used by professional traders who actively trade Indian benchmark indices. Here's how different types of traders apply VWAP across various instruments:
How Option Traders Use VWAP
Options traders on NIFTY 50, BANK NIFTY, FINNIFTY, and MIDCAP NIFTY use the underlying futures VWAP to make directional decisions. When the underlying index crosses above VWAP with volume, call option premiums tend to increase and put premiums decrease. Traders use this as a trigger to buy calls or sell puts. Conversely, a VWAP breakdown in the underlying is a signal to buy puts or sell calls. The key advantage is that VWAP on the underlying filters out much of the options-specific noise, providing cleaner directional signals for options strategies.
How Futures Traders Use VWAP
Futures traders on Nifty and Bank Nifty use VWAP as their primary directional filter. The rule is straightforward: take only long trades when the futures are above VWAP and only short trades when below. This single filter eliminates many losing trades by ensuring you're aligned with the dominant flow. Futures traders also use VWAP as a dynamic stop loss — if their long position sees the futures close below VWAP, they exit regardless of other indicators.
How Scalpers Use VWAP
Scalpers trading NIFTY and BANK NIFTY on 1-minute and 3-minute charts use VWAP as a quick-reference bias tool. If price is above VWAP, they only look for quick long scalps. If below, they only scalp the short side. The proximity of price to VWAP also helps scalpers identify low-risk entry points — the closer price is to VWAP, the tighter the stop loss can be. Scalpers particularly benefit from VWAP during the opening 90 minutes when volatility and volume are peak.
How Institutional Desks Use VWAP
Institutional trading desks at major Indian brokerages and fund houses use VWAP algorithms to execute large orders. When a fund needs to buy or sell a large block of Nifty futures or constituent stocks, they deploy VWAP execution algorithms that spread the order throughout the day, aiming to achieve an average execution price at or near the session's VWAP. This minimizes market impact and provides a fair benchmark for execution quality. Understanding this institutional behavior helps retail traders anticipate how large orders will influence VWAP-related price levels.
⚠️ Important Note: Always verify current market data from NSE India before taking trades. Market conditions change daily. The examples and concepts discussed are educational — past patterns do not guarantee future results. Indices like NIFTY 50, BANK NIFTY, FINNIFTY, and MIDCAP NIFTY have unique volatility characteristics that should be factored into your VWAP analysis.
Common VWAP Mistakes
Even experienced traders make critical errors when using VWAP. Recognizing and avoiding these mistakes can significantly improve your trading performance and protect your capital:
One of the biggest mistakes is going long when price is consistently below VWAP or shorting when it's above. VWAP represents the path of least resistance. Fighting it means fighting institutional flow. Always align your trades with VWAP direction.
VWAP without volume context is incomplete analysis. A VWAP crossover on low volume is significantly less reliable than one on high volume. Always check volume bars before acting on a VWAP signal — it's the difference between conviction and wishful thinking.
VWAP provides intraday bias, but ignoring the broader trend (daily, weekly) can lead to losses. If the daily chart shows a strong downtrend, bullish VWAP signals on the intraday chart may be mere pullbacks in the larger bear trend. Always check higher timeframes.
In choppy, range-bound markets, price can cross VWAP multiple times in a single session. Taking every crossover as a trade signal leads to death by a thousand cuts. Develop filters (volume, candle pattern, time of day) to select only the highest-probability crosses.
While VWAP is powerful, relying on it as your only indicator removes important confirmation layers. The best traders combine VWAP with at least one additional confluence factor — support/resistance, candlestick patterns, RSI, or volume profile. This multi-factor approach dramatically improves accuracy.
Entering a VWAP trade after price has already moved significantly from VWAP defeats the purpose. The best risk-reward comes from entries near VWAP. If price is far from VWAP, either wait for a pullback or skip the trade entirely. Late entries lead to wide stops and poor risk-reward ratios.
This is a cardinal sin in any trading approach, but particularly dangerous with VWAP trading. When a VWAP signal fails, it can fail fast and hard. Always have a predetermined stop loss before entering any VWAP trade. A common approach is to place the stop just beyond VWAP on the opposite side of your trade.
Best Indicator Combinations With VWAP
VWAP works best when combined with complementary indicators that provide additional confirmation. Here are the six most effective indicator combinations for Indian market traders:
Setup: Use RSI (14) as a momentum filter alongside VWAP. When price is above VWAP and RSI is between 50-70, take longs. When price is below VWAP and RSI is between 30-50, take shorts. Avoid trades when RSI is in extreme overbought (>80) or oversold (<20) territory as reversals become more likely. RSI divergence near VWAP provides the highest-probability reversal signals.
Setup: MACD (12, 26, 9) confirms VWAP signals with momentum confirmation. A bullish VWAP cross combined with a MACD bullish crossover (MACD line crossing above signal line) is a powerful double confirmation. The histogram expansion after this dual signal indicates increasing momentum. This combination filters out many false VWAP signals in choppy markets.
Setup: Volume Profile shows where the most volume has been traded at specific price levels. When VWAP aligns with a high-volume node (HVN) on the Volume Profile, it creates an extremely strong support or resistance zone. These confluence zones are institutional battlegrounds where significant buying or selling is likely to occur. This combination is considered one of the most advanced and effective for professional traders.
Setup: For Nifty and Bank Nifty traders, combining VWAP with open interest analysis provides market microstructure insights. Rising OI with price above VWAP indicates long buildup — bullish. Rising OI with price below VWAP indicates short buildup — bearish. Falling OI with VWAP crossover suggests short covering or long unwinding, which requires different trade management.
Setup: Pure price action patterns at VWAP create the cleanest trading signals. Look for hammer, engulfing, pin bar, inside bar, and morning/evening star patterns at VWAP levels. A bullish engulfing candle at VWAP support is one of the highest-conviction buy signals in intraday trading. This approach requires no additional indicators — just VWAP and candlestick reading skills.
Setup: This is particularly powerful for NSE index traders. Analyze the option chain for maximum pain, PCR (put-call ratio), and key OI changes at strike prices. When VWAP suggests a bullish bias and the option chain shows put writing at support levels, the dual confirmation provides high-confidence directional trades. Heavy call writing above current price combined with bearish VWAP signals confirms resistance.
Real Trading Examples
Let's examine three practical trading case studies that demonstrate how VWAP setups play out in real market conditions. These are representative examples based on common patterns seen in NSE trading sessions:
Advantages and Limitations of VWAP
Like every indicator, VWAP has its strengths and weaknesses. Understanding both will help you deploy it effectively and avoid situations where it may lead you astray:
✅ Advantages
- Provides exceptional trend clarity for intraday traders — above VWAP = bullish, below = bearish
- Serves as the primary institutional benchmark for execution quality measurement
- Acts as strong dynamic support and resistance that adapts to real-time market conditions
- Incorporates volume in calculation, making it more accurate than price-only indicators
- Works across all liquid instruments — stocks, futures, indices, and ETFs
- Simple to interpret — even beginner traders can use the basic concept effectively
- Helps identify fair value of a security during the trading session
- Reduces emotional trading by providing objective reference points
- Available for free on virtually all modern charting platforms
- Excellent for confirming other technical signals — adds confluence to any trading system
⚠️ Limitations
- Becomes increasingly lagging as the trading session progresses due to cumulative calculation
- Primarily an intraday indicator — resets daily, limiting its use for swing trading
- Less effective during news-driven events where volume is distorted by panic or euphoria
- Can produce multiple false crossover signals in choppy, range-bound markets
- Not useful for low-liquidity stocks where volume is insufficient for meaningful analysis
- Does not account for after-hours activity, gap openings, or pre-market trends
- Requires additional confirmation — shouldn't be used as a standalone trading system
- VWAP bands may differ across platforms depending on standard deviation settings
- Flattens in the afternoon, providing less actionable information in the last 90 minutes
Frequently Asked Questions
Here are the most commonly asked questions about VWAP indicator, answered in detail for Indian stock market traders:
VWAP stands for Volume Weighted Average Price. It is a technical analysis indicator that calculates the average price a security has traded at throughout the day, weighted by volume. It provides a benchmark that reflects the true average price paid by all market participants during the current trading session. VWAP is displayed as a single line on intraday charts and is one of the most important tools used by institutional and retail traders alike.
Yes, VWAP is one of the most effective indicators for intraday trading. It helps traders identify the fair value of a stock during the trading session and determine whether they are buying at a premium or discount relative to the day's average traded price. Its volume-weighted nature makes it especially valuable for confirming the strength of intraday moves and identifying high-probability entry and exit points. Most professional intraday traders consider VWAP an essential tool.
Yes, VWAP can be applied to the underlying asset (like Nifty or Bank Nifty futures) to make options trading decisions. When the underlying crosses above VWAP with volume, traders may consider buying call options or selling put options. When it falls below VWAP, put options may be purchased or calls may be sold. The key is to apply VWAP to the underlying instrument, not the option itself, as option prices are influenced by many factors beyond just direction.
VWAP and EMA serve different purposes and neither is universally "better." VWAP incorporates volume in its calculation, making it superior for intraday trading and institutional benchmarking. EMA is purely price-based and works better for swing trading, positional trading, and multi-day trend analysis. For intraday trading on NSE, VWAP is generally preferred by professional traders. Many use both — VWAP for intraday and EMA for higher timeframe context.
VWAP is highly accurate as an intraday benchmark because it factors in both price and volume. However, its accuracy depends on the liquidity of the stock. Highly liquid stocks like Nifty 50 components and Bank Nifty provide more reliable VWAP signals than low-volume penny stocks. VWAP is most accurate during the first half of the trading session when volume data is fresh and meaningful. In the afternoon, its accuracy as a trading signal diminishes as it flattens.
VWAP is primarily designed for intraday timeframes. The most popular timeframes are 1-minute, 3-minute, 5-minute, and 15-minute charts. For scalping, 1-3 minute charts work best as they provide more granular data. For swing intraday trades, 5-15 minute charts are ideal as they filter out minor noise while still providing timely signals. The VWAP calculation itself is the same regardless of the chart timeframe — only your view of price action relative to VWAP changes.
Yes, the standard VWAP resets at the beginning of each trading session. On NSE, this means it resets at 9:15 AM IST every trading day. This daily reset makes VWAP a purely intraday indicator. However, anchored VWAP (available on platforms like TradingView) can be set from any specific date, time, or event and does not reset automatically — this variant is useful for multi-day analysis.
Institutional traders use VWAP as a benchmark to evaluate their execution quality. They aim to buy below VWAP and sell above VWAP. Many institutional algorithms are designed to execute large orders at or near VWAP to minimize market impact. Fund managers evaluate their dealers' performance based on whether they achieved prices better or worse than VWAP. This makes VWAP the single most important reference price in institutional trading.
Absolutely. VWAP is extremely popular among Bank Nifty traders, especially for futures and options scalping. Bank Nifty's high liquidity and volatility make VWAP an excellent tool for identifying intraday support, resistance, and trend direction. Many full-time traders use VWAP as their primary indicator for Bank Nifty scalping, combined with price action and volume analysis for confirmation.
VWAP (Volume Weighted Average Price) weights price by volume, giving more importance to prices where heavy trading occurred. TWAP (Time Weighted Average Price) simply averages the price over equal time intervals regardless of volume. VWAP is generally more useful for active traders because it reflects where real money exchanged hands. TWAP is simpler but less informative. Most professional traders prefer VWAP over TWAP for its superior accuracy.
No, VWAP should not be used in isolation. It is most effective when combined with other indicators like RSI, MACD, Volume Profile, Price Action patterns, and Open Interest analysis. Using VWAP as part of a comprehensive trading system yields the best results. Think of VWAP as the foundation of your analysis — it provides directional bias, but you need additional tools for timing entries, managing risk, and confirming signal quality.
When the price is above VWAP, it indicates that the current price is higher than the average price paid by all participants, suggesting bullish sentiment. Buyers are in control and the stock is trading at a premium to its volume-weighted fair value. In this condition, long trades have a higher probability of success and short trades carry more risk. VWAP acts as dynamic support below the price.
Yes, VWAP is one of the most beginner-friendly indicators. Its core concept is straightforward — price above VWAP suggests bullish bias, price below suggests bearish bias. Beginners should start by simply observing how price interacts with VWAP across different stocks and indices. Practice on paper trades before committing real capital. As you gain experience, gradually add volume analysis and complementary indicators to build a complete trading system.
When the price is below VWAP, it means the stock is trading below the average price weighted by volume, indicating bearish sentiment. Sellers are dominant and the stock is at a discount relative to where most volume has traded. Short trades have higher probability in this zone. VWAP acts as dynamic resistance above the price. Buying in this zone is risky unless there are strong reversal signals with volume confirmation.
Yes, VWAP is available on most popular charting platforms including TradingView (free tier), Zerodha Kite, Upstox Pro, Angel One, Groww, and most other Indian broker platforms. It is a standard indicator built into the platform and does not require a premium subscription on most services. Some advanced variations like Anchored VWAP may require premium access on certain platforms.
Latest NSE Market Perspective
VWAP has become an integral part of modern Indian stock market trading. As market participation has grown and technology has advanced, VWAP's role has only become more prominent. Here's how VWAP is being used across different segments of the Indian market:
Index traders use VWAP on 5-minute and 15-minute charts to establish intraday directional bias. The high liquidity of Nifty and Sensex makes VWAP extremely reliable as a support/resistance tool. Algorithmic trading systems tracking Nifty use VWAP as a core component of their execution logic. FIIs and DIIs benchmark their index executions against VWAP daily.
Bank Nifty's high volatility and massive options market make VWAP a critical tool for both futures and options traders. Scalpers use VWAP on 1-3 minute charts for quick directional trades. Options sellers use VWAP on the underlying to decide strike selection and direction. The banking sector's concentration (few heavyweight stocks) makes VWAP particularly effective for Bank Nifty analysis.
Single stock futures traders use VWAP to confirm directional setups from other technical analysis. When a stock shows a bullish chart pattern and the futures price is above VWAP, it provides the confidence to enter with larger position sizes. VWAP combined with open interest data in stock futures provides powerful insights into whether smart money is building longs or shorts.
Advanced traders combine VWAP on the underlying with option chain data. When the underlying is above VWAP and the option chain shows heavy put writing at support levels, it confirms bullish bias. When the underlying is below VWAP with call writing above, it confirms bearish outlook. This synthesis of VWAP and options data creates a comprehensive market view that few retail traders utilize.
📋 Market conditions change daily. Traders should combine VWAP with current NSE price action, volume analysis, option chain data, and proper risk management. Never rely on a single indicator or past patterns for future trading decisions. Always verify current market data, check for corporate actions, and account for macro-economic events before placing trades. This article is for educational purposes only and does not constitute financial advice.
📚 Related Articles You May Like
- 📊 Complete Guide to RSI Indicator for Indian Traders
- 📈 MACD Trading Strategy — Nifty & Bank Nifty
- 🔢 Open Interest Analysis — NSE Options Trading
- 📉 Support & Resistance Trading Strategies
- 🕯️ Price Action Trading — Complete Beginner Guide
- 📊 Volume Profile Analysis for Indian Markets
- 💹 Option Chain Analysis — How to Read & Trade
- 📋 Risk Management for Indian Stock Traders
Conclusion
VWAP is more than just a line on your chart — it is a window into institutional thinking, a compass for intraday direction, and a framework for making disciplined trading decisions. Throughout this comprehensive guide, we've explored every facet of this remarkable indicator.
- VWAP is the Volume Weighted Average Price — the true average price at which a security trades during a session, weighted by volume
- It works because it incorporates volume, making it more accurate than price-only indicators and directly reflecting where real money has changed hands
- Institutions use it as their primary execution benchmark — understanding this helps retail traders align with smart money flow
- Retail traders benefit from VWAP as a dynamic support/resistance, trend filter, and objective entry/exit framework that removes emotional decision-making
- Multiple strategies — bounce, breakout, pullback, reversal, and price action — provide setups for every market condition
- Best combined with RSI, MACD, Volume Profile, Open Interest, and Price Action for the highest-probability trading system
- Risk management is paramount — always use stop losses, proper position sizing, and predetermined exit plans regardless of how strong the VWAP signal appears
- Practice first — paper trade VWAP strategies before deploying real capital. Understand the indicator's strengths and limitations in different market conditions
The journey from understanding VWAP to mastering it takes time, patience, and deliberate practice. Start by simply observing VWAP on your charts for a few weeks. Notice how price interacts with it — the bounces, breakdowns, and the role of volume in confirming or denying signals. Then gradually begin paper trading the setups described in this guide. Only when you are consistently profitable on paper should you transition to real capital with small position sizes.
Remember: no indicator is perfect, and VWAP is no exception. But when used correctly — with proper volume confirmation, complementary indicators, and disciplined risk management — VWAP can become the cornerstone of a profitable intraday trading system. The best traders in India and around the world use VWAP every single day. Now you have the knowledge to join them.
Trade smart. Manage risk. Let VWAP guide your way.