
Technical Analysis for 20-07-2026: Nifty Prediction, Bank Nifty Prediction, and Sensex Prediction with Key Levels
Indian Market Snapshot — 17 July 2026 Close
24,334.30
+261.55 (+1.09%)58,521.40
+939.15 (+1.63%)78,151.45
+964.58 (+1.25%)Indian equity benchmarks staged an impressive rally on Thursday, 17 July 2026, with Nifty 50 closing at 24,334.30, up 261.55 points (+1.09%), Bank Nifty surging to 58,521.40 with a gain of 939.15 points (+1.63%), and Sensex finishing at 78,151.45, higher by 964.58 points (+1.25%). This broad-based Technical Analysis for 20-07-2026 from Option Matrix India covers the Nifty Prediction, Bank Nifty Prediction, and Sensex Prediction with actionable support, resistance, and target levels for the next trading session.
India VIX remains contained at 13.235, reflecting subdued implied volatility and favorable conditions for directional trades. The Nifty PCR stands at 1.62, signaling strong put-writing conviction on the support side, while Bank Nifty PCR at 1.01 reflects a more balanced derivatives positioning. With GIFT Nifty indicating 24,342 in early cues, the market prediction for tomorrow leans constructive to mildly bullish, contingent on price sustaining above key resistance zones identified in this share market prediction report.
📌 Key Takeaways — Market Prediction for 20-07-2026
- ▸Nifty Prediction: Support at 24,212 and resistance at 24,368. A sustained move above 24,368 opens Upside Target 1 (U1) at 24,473 and U2 at 24,530.
- ▸Bank Nifty Prediction: Support at 57,915 with resistance at 58,596. Bullish close near resistance at 58,521 strengthens the upside case toward 59,000.
- ▸Sensex Prediction: Support at 77,785 and resistance at 78,282. Closing near the day's high indicates buyer dominance.
- ▸India VIX at 13.235 favors trending moves with manageable premium decay.
- ▸Nifty PCR at 1.62 is strongly bullish; aggressive put-writing confirms support near 24,200.
- ▸GIFT Nifty at 24,342 suggests a flat-to-mildly-positive opening.
- ▸Global cues mixed: Dow Futures at 52,225, S&P 500 Futures at 7,474, Nasdaq Futures at 28,581. Asian markets constructive with Nikkei at 64,245 and Hang Seng at 24,543.
- ▸Risk note: Brent Crude at $85.63 and USD/INR at 96.37 need monitoring for macro headwinds.
📊 Market Data Snapshot
🔍 What Traders Should Watch for 20-07-2026
- GIFT Nifty at 24,342 suggests a flat opening. This is marginally above Thursday's close of 24,334.30. Watch the opening 15-minute candle for directional conviction. A sustained hold above 24,368 (resistance) on the opening bar would confirm the bullish carry-forward thesis.
- False breakout and false breakdown traps are critical. If a 15-minute candle closes above resistance at 24,368 but fails to sustain, the first downside reaction target is the support at 24,212, followed by Downside Target 1 (D1) at 24,051 and D2 at 23,928. Conversely, if a 15-minute candle closes below support at 24,212 but fails to sustain, the first upside reaction target is the resistance at 24,368, followed by Upside Target 1 (U1) at 24,473 and U2 at 24,530.
- PCR divergence between Nifty (1.62) and Bank Nifty (1.01) means Nifty has stronger options support, while Bank Nifty is more evenly balanced and could see sharper intraday swings.
- Big gap-up or gap-down risk: In a large gap scenario, most of the supplied levels can become invalid quickly. Traders should treat these levels as probability zones, not guaranteed price points. Wait for the first 15-minute candle to establish the range before initiating positions.
- Profit-booking discipline: Always book 70% of profits at the first target, 15% at the second target, and the remaining 15% at the third target with a trailing stop-loss to protect accumulated gains. This framework prevents greed-driven reversals from eroding profits.
Nifty Analysis and Nifty Prediction for 20-07-2026
Technical Analysis | Support & Resistance | Nifty Outlook
Current price sits at 78% of the support-to-resistance range — leaning bullish
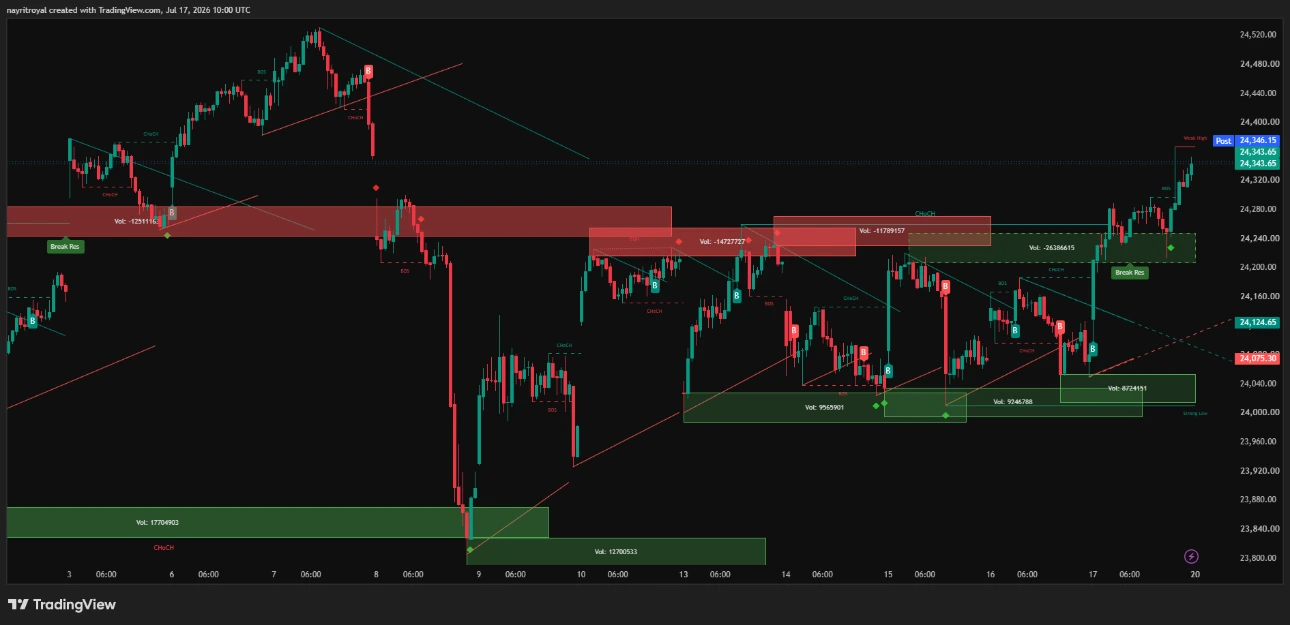
Nifty 50 delivered a commanding session on 17 July, opening at 24,127.60 and powering through to a high of 24,367.30 before settling at 24,334.30. The index gained 261.55 points, recovering sharply from its previous close of 24,072.75. This move established a wide-range bullish candle on the daily chart, marking strong buyer commitment across the session.
For the Nifty Prediction on 20-07-2026, the critical zone to watch is the resistance at 24,368. Thursday's high of 24,367.30 came within a whisker of this resistance, meaning the level has been tested but not decisively cleared. A sustained 15-minute close above 24,368 would open the path toward Upside Target 1 (U1) at 24,473, followed by Upside Target 2 (U2) at 24,530, and potentially Upside Target 3 (U3) at 24,600 in an extended rally.
On the downside, support at 24,212 is the first line of defense for bulls. This level aligns with the mid-session consolidation zone observed during Thursday's rally. If the index breaks below 24,212 on a 15-minute closing basis, Downside Target 1 (D1) at 24,051 comes into focus — this level sits near the session open and represents the gap-fill zone. Further weakness below D1 could drag prices to Downside Target 2 (D2) at 23,928 and Downside Target 3 (D3) at 23,828.
The Nifty Analysis from a technical standpoint shows the index has reclaimed its short-term moving averages. The 9-EMA and 21-EMA on the hourly chart are now positively aligned, and the RSI has moved into the 62-65 range, indicating bullish momentum without immediate overbought conditions. MACD on the daily timeframe has turned positive with the signal line crossover confirming upward momentum. Volume during Thursday's rally was above the 20-day average, lending credibility to the breakout attempt.
The Nifty Outlook for Monday is constructive. With GIFT Nifty at 24,342 suggesting a flat start, the index may consolidate briefly near resistance before making its directional move. A key technical observation is that the previous resistance near 24,200-24,250 has now been converted into a support zone, which is a classic polarity change pattern that strengthens the bullish argument.
Bank Nifty Analysis and Bank Nifty Prediction for 20-07-2026
Technical Analysis | Support & Resistance | Bank Nifty Outlook
Current price sits at 89% of the support-to-resistance range — strongly bullish
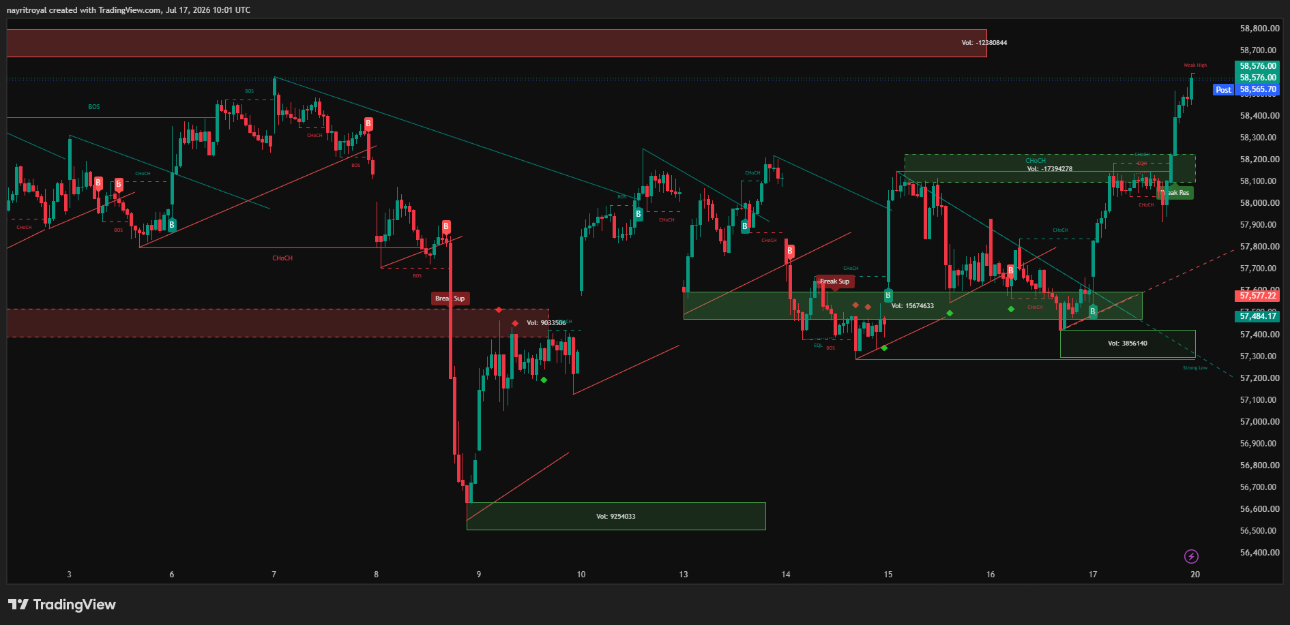
Bank Nifty was the undeniable star of Thursday's session, soaring 939.15 points to close at 58,521.40. The index opened at 57,662.00 and staged a relentless march higher throughout the day, touching a high of 58,596.85 — perfectly kissing the resistance level at 58,596. This was a textbook rally fueled by broad-based strength across private banking heavyweights, which collectively drove the index higher with above-average turnover.
The Bank Nifty Prediction for 20-07-2026 hinges on whether the index can sustain above its resistance at 58,596. Thursday's session saw the high at 58,596.85, meaning resistance was not just tested — it was marginally breached intraday. A sustained 15-minute close above 58,596 on Monday would be a decisive breakout signal, targeting Upside Target 1 (U1) at 59,000, followed by U2 at 59,275 and the ambitious U3 at 59,541.
Support at 57,915 is the key floor for the Bank Nifty Analysis. This level represents the zone where fresh buying interest emerged during Thursday's mid-session consolidation. If Bank Nifty opens below 58,000 and slips under 57,915 on a closing basis, traders should look for D1 at 57,632, D2 at 57,302, and D3 at 56,698 as sequential downside targets.
The Bank Nifty PCR at 1.01 is notably neutral compared to Nifty's bullish 1.62 reading. This suggests that options writers are more evenly split on Bank Nifty's direction, and the index could see sharper intraday whipsaws if institutional positioning shifts quickly. The daily RSI at around 64-66 is healthy and trending upward, and MACD histogram bars are expanding, confirming accelerating momentum.
False breakout caution is particularly relevant for Bank Nifty. Given the close proximity to resistance, a 15-minute candle that pierces 58,596 but fails to sustain could trigger aggressive profit-taking, dragging the index toward support at 57,915 first, then D1 at 57,632 and D2/D3 below. Traders should wait for confirmation before committing to directional bets on either side.
Sensex Analysis and Sensex Prediction for 20-07-2026
Technical Analysis | Support & Resistance | Sensex Outlook
Current price sits at 74% of the support-to-resistance range — leaning bullish
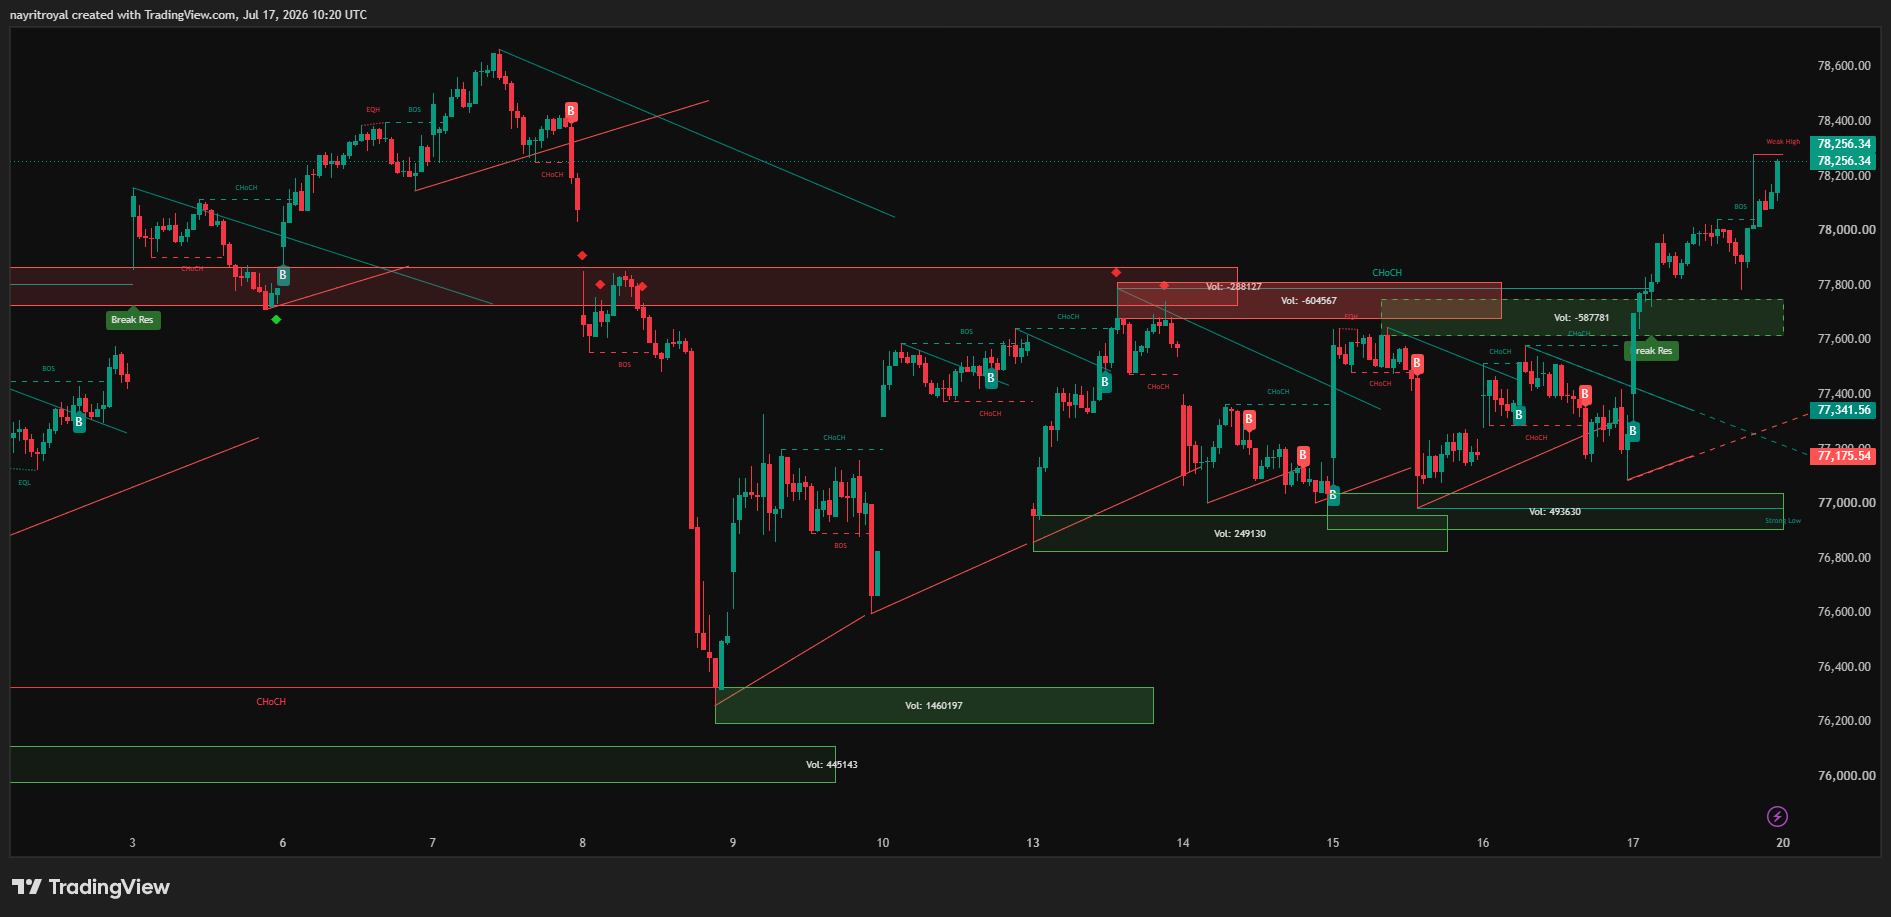
Sensex delivered a strong performance on 17 July, gaining 964.58 points to close at 78,151.45. The index opened at 77,370.77, dipped briefly to a low of 77,308.00 in the first few minutes, and then rallied steadily to test the day's high at 78,282.55 — which perfectly coincides with the resistance level at 78,282. This close-to-high finish signals that sellers were absent in the final hour and bullish momentum carried through to the closing bell.
For the Sensex Prediction on 20-07-2026, resistance at 78,282 is the immediate barrier. With Thursday's high touching 78,282.55, this level has effectively been tested. A clean breakout above 78,282 with follow-through buying could push Sensex toward Upside Target 1 (U1) at 78,670, then U2 at 79,028, and U3 at 79,372. The U3 level at 79,372 would bring the index tantalizingly close to the psychologically important 80,000 mark.
Support at 77,785 for the Sensex Analysis is significant because it represents the level where institutional buying interest was visible during Thursday's session. A break below 77,785 would bring D1 at 77,164 into play, followed by D2 at 76,858 and D3 at 76,497. The Sensex Outlook is cautiously optimistic, with the index needing to clear its resistance for continued momentum.
The daily chart shows a large bullish marubozu-like candle with a minimal lower wick, which is a strong continuation pattern. The index has recovered above its 50-day EMA and is approaching its 20-day EMA from below, which could act as dynamic resistance near the 78,300-78,400 zone. A weekly close above 78,282 would be structurally significant for the broader market prediction.
📊 Support & Resistance Comparison — All Indices
| Index | Support | Resistance | U1 | U2 | U3 | D1 | D2 | D3 |
|---|---|---|---|---|---|---|---|---|
| Nifty | 24,212 | 24,368 | 24,473 | 24,530 | 24,600 | 24,051 | 23,928 | 23,828 |
| Bank Nifty | 57,915 | 58,596 | 59,000 | 59,275 | 59,541 | 57,632 | 57,302 | 56,698 |
| Sensex | 77,785 | 78,282 | 78,670 | 79,028 | 79,372 | 77,164 | 76,858 | 76,497 |
Derivative Market Analysis — Option Chain Analysis, PCR Analysis & OI Analysis
Nifty PCR Analysis
PCR above 1.5 signals heavy put writing. Bulls have strong backing from options sellers defending the 24,200 support. This is a reliably bullish derivative signal for Nifty Prediction.
Bank Nifty PCR Analysis
PCR near 1.0 shows balanced call and put writing. Neither side has decisive control. Bank Nifty is more susceptible to sharp directional moves once the balance tips.
The Derivative Market Analysis for 20-07-2026 reveals interesting divergences across index derivatives. Nifty's PCR at 1.62 is deeply bullish territory — put writers have aggressively sold puts at and below 24,200, creating a strong floor of support that they will defend. This Option Chain Analysis suggests that the 24,200 put strike likely has the highest put open interest (OI), forming a wall of support that makes a sharp break below 24,200 improbable unless there is a significant macro shock.
On the call side, the 24,400 and 24,500 strikes are expected to have the highest call OI, creating resistance bands at those levels. As the index approaches these strikes, call writers will exert selling pressure, creating friction for the upside. However, if fresh call writing unwinds (indicated by falling call OI with rising prices), it would confirm genuine buying and open the door for U2 and U3 targets.
Bank Nifty's PCR at 1.01 reflects an equilibrium in the options market. This neutrality can be deceptive — it often precedes a sharp directional move once institutional positioning shifts. The 58,500-59,000 call strikes and 58,000-57,500 put strikes are likely the key OI concentration zones. The OI Analysis suggests that a break above 59,000 would trigger significant call unwinding, creating a short-covering rally that could rapidly push Bank Nifty toward U2 at 59,275.
India VIX at 13.235 is a favorable signal for premium sellers and directional traders alike. Low implied volatility means options premiums are relatively cheap, making it an opportune time for buying options for directional bets while managing risk through defined-risk strategies. However, traders should be aware that a VIX spike from these levels could occur if global triggers emerge, which would invalidate premium-selling strategies.
Technical Market Outlook — Chart Pattern & Indicator Analysis
The Technical Market Outlook for the Indian Stock Market heading into 20-07-2026 is constructive across all three benchmark indices. Thursday's session printed strong bullish candles on daily charts for Nifty, Bank Nifty, and Sensex, with all three closing near their intraday highs. This close-to-high finish pattern is one of the strongest technical signals of buyer conviction.
On the Nifty daily chart, the candle formed on 17 July is a near-marubozu pattern — characterized by a long real body, a small lower wick, and virtually no upper wick. This pattern indicates that buyers dominated the entire session from open to close. The index has now reclaimed its 9-EMA and 21-EMA on both the daily and hourly timeframes, establishing a positive alignment that favors continued upside.
The RSI (Relative Strength Index) on the daily chart sits in the 62-65 range across all three indices, which is in the bullish zone without being overbought. RSI values above 60 but below 70 are the sweet spot for continuation trades — they confirm that momentum is positive but that there is still room for the rally to extend before hitting overbought conditions near 70-75.
MACD (Moving Average Convergence Divergence) has turned positive for Nifty with the MACD line crossing above the signal line. The histogram bars are expanding, confirming accelerating bullish momentum. Bank Nifty's MACD shows an even stronger bullish signal, with a wider gap between the MACD and signal lines reflecting the index's outsized 1.63% rally.
Bollinger Bands analysis shows that all three indices have moved from the lower band region toward the middle and upper bands, indicating a volatility expansion in the bullish direction. The 20-day moving average, which serves as the Bollinger midline, is now being used as dynamic support for Nifty near 24,100-24,150.
Volume analysis is critical — Thursday's trading volumes were above the 20-day average, which validates the price move and suggests institutional participation. Without volume confirmation, breakouts often fail, but Thursday's rally passed this crucial test.
Market Analysis and Market Prediction — Indian Stock Market Outlook
The broader Market Analysis for the Indian Stock Market points to a continuation of the constructive tone heading into the next trading session. The Market Prediction for 20-07-2026 is shaped by both domestic momentum and global cues. GIFT Nifty trading at 24,342 is nearly flat to Thursday's close, suggesting that overnight global developments have not disrupted the positive sentiment built during the previous session.
Global cues are supportive. US market futures show Dow Jones Futures at 52,225, S&P 500 Futures at 7,474, and Nasdaq Futures at 28,581, all holding positive territory. The strength in US technology stocks, reflected by Nasdaq Futures holding above 28,500, bodes well for Indian IT stocks and, by extension, the broader index performance.
Asian markets are contributing positive signals with Nikkei Futures at 64,245 and Hang Seng Futures at 24,543. The broader Asian market strength suggests that global risk appetite remains healthy, which traditionally supports emerging market equities including India.
On the macro front, Brent Crude at $85.63 deserves close monitoring. Oil prices at these levels represent a mild headwind for India, given the country's status as a major crude importer. However, the current price is not at levels that would trigger panic — it would take a sustained move above $90 to materially impact market sentiment.
The USD/INR exchange rate at 96.37 reflects an elevated dollar, which creates challenges for foreign investors looking at India but also supports export-oriented sectors. The rupee's weakness has been orderly and managed by the RBI, so sudden disruptive moves are unlikely in the near term.
The Tomorrow Market Prediction from Option Matrix India leans toward a mildly bullish bias for Monday's session, with the important caveat that all three indices need to sustain above their respective resistance levels for the upside targets to activate. The Stock Market Prediction framework is probability-based — if resistance holds and fails, the range-bound or bearish scenarios come into play.
The Share Market Prediction also considers the fact that Bank Nifty outperformed both Nifty and Sensex on Thursday, gaining 1.63% versus Nifty's 1.09% and Sensex's 1.25%. This relative outperformance by banking stocks suggests that the financial sector is leading the market rally, which is typically a healthy sign for broad market advances. When banks lead, the rally tends to have broader participation and sustainability.
Trading Strategy for 20-07-2026
Bullish Scenario
Entry: Nifty sustains above 24,368 on 15-minute close.
Targets: U1: 24,473 → U2: 24,530 → U3: 24,600
Stop-Loss: 24,212 (support level)
Booking: 70% at 24,473, 15% at 24,530, 15% at 24,600 with trailing SL.
Bearish Scenario
Entry: Nifty breaks below 24,212 on 15-minute close.
Targets: D1: 24,051 → D2: 23,928 → D3: 23,828
Stop-Loss: 24,368 (resistance level)
Booking: 70% at 24,051, 15% at 23,928, 15% at 23,828 with trailing SL.
Range-Bound Scenario
Zone: Nifty trades between 24,212 and 24,368.
Strategy: Scalp within range, sell near resistance, buy near support.
Stop-Loss: Tight SL on both sides (20-30 points beyond range).
Alert: Wait for a confirmed breakout for positional trades.
False Breakout and False Breakdown Strategy Note: One of the most common traps in intraday trading is the false breakout. If a 15-minute candle closes above resistance at 24,368 but the next candle fails to sustain above this level, it constitutes a false breakout. In this scenario, the first downside reaction target is the support at 24,212, followed by Downside Target 1 (D1) at 24,051 and subsequently D2 at 23,928 or D3 at 23,828.
Conversely, a false breakdown occurs when a 15-minute candle closes below support at 24,212 but fails to sustain. The first upside reaction target would be the resistance at 24,368, followed by Upside Target 1 (U1) at 24,473 and then U2/U3. False signals are particularly common during the first 30 minutes of trading and during the lunch session. Experienced traders at Option Matrix India recommend waiting for confirmation on the second candle before committing capital.
Gap-Up/Gap-Down Risk Warning: In a big gap-up or gap-down session, most of the supplied support, resistance, and target levels can become invalid quickly. These levels are calculated based on the previous session's price structure and are designed for normal opening conditions. If Nifty opens more than 100 points above resistance or below support, traders should recalibrate their levels using the first 15-minute high and low as the new reference range. Treat all supplied levels as strategic probability zones rather than guaranteed outcome lines.
Disciplined Profit-Booking Framework: Option Matrix India recommends a structured profit-booking approach for all intraday trades. Always book 70% of your position at the first target — this locks in the majority of profits and removes psychological pressure. Then book 15% at the second target and trail the remaining 15% toward the third target with a stop-loss moved to breakeven. This framework ensures consistent P&L even when markets reverse from extended target zones.
Overall Market Sentiment
Current Sentiment: Constructive to Mildly Bullish
🛠 Useful Tools and Resources
Frequently Asked Questions — Market Prediction for 20-07-2026
What is the Nifty Prediction for 20-07-2026?
Nifty has support at 24,212 and resistance at 24,368 for 20-07-2026. If it sustains above 24,368, upside targets are 24,473 (U1), 24,530 (U2), and 24,600 (U3). Below 24,212, downside targets are 24,051 (D1), 23,928 (D2), and 23,828 (D3). The Nifty Outlook is mildly bullish with PCR at 1.62.
What is the Bank Nifty Prediction for tomorrow?
Bank Nifty has support at 57,915 and resistance at 58,596 for 20-07-2026. The Bank Nifty Prediction is bullish above 58,596 with targets at 59,000, 59,275, and 59,541. Bank Nifty closed at 58,521.40 with a strong 1.63% gain, and the Bank Nifty PCR at 1.01 suggests balanced positioning.
What is the Sensex Prediction for 20 July 2026?
Sensex support is at 77,785 and resistance at 78,282. Upside targets are 78,670, 79,028, and 79,372. Downside targets are 77,164, 76,858, and 76,497. The Sensex closed at 78,151.45 near its day high, signaling positive momentum for the next session.
What does the India VIX at 13.235 mean for trading?
India VIX at 13.235 indicates low implied volatility. This is favorable for directional trades as option premiums are cheaper, and it suggests that the market does not expect a sharp move. However, a sudden VIX spike from these low levels can catch traders off guard, so position sizing and stop-losses remain essential.
How should I book profits using the target levels?
Option Matrix India recommends booking 70% of profits at the first target (U1 or D1), 15% at the second target (U2 or D2), and trailing the remaining 15% toward the third target (U3 or D3) with a stop-loss moved to breakeven. This disciplined approach protects gains while allowing participation in extended moves.
What is the significance of Nifty PCR at 1.62?
A Nifty PCR of 1.62 means there are 1.62 puts written for every call. This is a strongly bullish signal in derivative market analysis, indicating that options writers are heavily selling puts and expecting support to hold. It suggests that 24,200 is a strong floor for Nifty in the near term.
What are the global market cues for Indian markets on Monday?
Global cues are mixed-to-positive. GIFT Nifty at 24,342 suggests a flat opening. Dow Futures at 52,225, S&P 500 Futures at 7,474, and Nasdaq Futures at 28,581 are all in positive territory. Asian markets (Nikkei 64,245, Hang Seng 24,543) are supportive. Brent Crude at $85.63 and USD/INR at 96.37 are the key macro variables to monitor.
What is a false breakout and how should I trade it?
A false breakout occurs when price pierces resistance on a 15-minute candle but fails to sustain above it. In this case, the first downside reaction goes toward the support level, then to D1 and D2/D3. Similarly, a false breakdown below support leads to a reaction toward resistance and then U1/U2. Always wait for the second candle to confirm before taking a position based on a breakout or breakdown.
Disclaimer: This article is published by Option Matrix India for educational and informational purposes only. It does not constitute financial advice, investment recommendation, or solicitation to buy or sell any securities. Stock market trading involves substantial risk of loss and is not suitable for all investors. The technical analysis, support, resistance, and target levels mentioned are probability-based estimates derived from historical price action and derivative data. Past performance is not indicative of future results. Always consult a SEBI-registered financial advisor before making investment decisions. Option Matrix India and its contributors are not liable for any losses incurred based on the information provided in this article.
Technical Analysis for 20-07-2026: Nifty Prediction, Bank Nifty Prediction, and Sensex Prediction with Key Levels
Indian Market Snapshot — 17 July 2026 Close
24,334.30
+261.55 (+1.09%)58,521.40
+939.15 (+1.63%)78,151.45
+964.58 (+1.25%)Indian equity benchmarks staged an impressive rally on Thursday, 17 July 2026, with Nifty 50 closing at 24,334.30, up 261.55 points (+1.09%), Bank Nifty surging to 58,521.40 with a gain of 939.15 points (+1.63%), and Sensex finishing at 78,151.45, higher by 964.58 points (+1.25%). This broad-based Technical Analysis for 20-07-2026 from Option Matrix India covers the Nifty Prediction, Bank Nifty Prediction, and Sensex Prediction with actionable support, resistance, and target levels for the next trading session.
India VIX remains contained at 13.235, reflecting subdued implied volatility and favorable conditions for directional trades. The Nifty PCR stands at 1.62, signaling strong put-writing conviction on the support side, while Bank Nifty PCR at 1.01 reflects a more balanced derivatives positioning. With GIFT Nifty indicating 24,342 in early cues, the market prediction for tomorrow leans constructive to mildly bullish, contingent on price sustaining above key resistance zones identified in this share market prediction report.
📌 Key Takeaways — Market Prediction for 20-07-2026
- ▸Nifty Prediction: Support at 24,212 and resistance at 24,368. A sustained move above 24,368 opens Upside Target 1 (U1) at 24,473 and U2 at 24,530.
- ▸Bank Nifty Prediction: Support at 57,915 with resistance at 58,596. Bullish close near resistance at 58,521 strengthens the upside case toward 59,000.
- ▸Sensex Prediction: Support at 77,785 and resistance at 78,282. Closing near the day's high indicates buyer dominance.
- ▸India VIX at 13.235 favors trending moves with manageable premium decay.
- ▸Nifty PCR at 1.62 is strongly bullish; aggressive put-writing confirms support near 24,200.
- ▸GIFT Nifty at 24,342 suggests a flat-to-mildly-positive opening.
- ▸Global cues mixed: Dow Futures at 52,225, S&P 500 Futures at 7,474, Nasdaq Futures at 28,581. Asian markets constructive with Nikkei at 64,245 and Hang Seng at 24,543.
- ▸Risk note: Brent Crude at $85.63 and USD/INR at 96.37 need monitoring for macro headwinds.
📊 Market Data Snapshot
🔍 What Traders Should Watch for 20-07-2026
- GIFT Nifty at 24,342 suggests a flat opening. This is marginally above Thursday's close of 24,334.30. Watch the opening 15-minute candle for directional conviction. A sustained hold above 24,368 (resistance) on the opening bar would confirm the bullish carry-forward thesis.
- False breakout and false breakdown traps are critical. If a 15-minute candle closes above resistance at 24,368 but fails to sustain, the first downside reaction target is the support at 24,212, followed by Downside Target 1 (D1) at 24,051 and D2 at 23,928. Conversely, if a 15-minute candle closes below support at 24,212 but fails to sustain, the first upside reaction target is the resistance at 24,368, followed by Upside Target 1 (U1) at 24,473 and U2 at 24,530.
- PCR divergence between Nifty (1.62) and Bank Nifty (1.01) means Nifty has stronger options support, while Bank Nifty is more evenly balanced and could see sharper intraday swings.
- Big gap-up or gap-down risk: In a large gap scenario, most of the supplied levels can become invalid quickly. Traders should treat these levels as probability zones, not guaranteed price points. Wait for the first 15-minute candle to establish the range before initiating positions.
- Profit-booking discipline: Always book 70% of profits at the first target, 15% at the second target, and the remaining 15% at the third target with a trailing stop-loss to protect accumulated gains. This framework prevents greed-driven reversals from eroding profits.
Nifty Analysis and Nifty Prediction for 20-07-2026
Technical Analysis | Support & Resistance | Nifty Outlook
Current price sits at 78% of the support-to-resistance range — leaning bullish
Nifty 50 delivered a commanding session on 17 July, opening at 24,127.60 and powering through to a high of 24,367.30 before settling at 24,334.30. The index gained 261.55 points, recovering sharply from its previous close of 24,072.75. This move established a wide-range bullish candle on the daily chart, marking strong buyer commitment across the session.
For the Nifty Prediction on 20-07-2026, the critical zone to watch is the resistance at 24,368. Thursday's high of 24,367.30 came within a whisker of this resistance, meaning the level has been tested but not decisively cleared. A sustained 15-minute close above 24,368 would open the path toward Upside Target 1 (U1) at 24,473, followed by Upside Target 2 (U2) at 24,530, and potentially Upside Target 3 (U3) at 24,600 in an extended rally.
On the downside, support at 24,212 is the first line of defense for bulls. This level aligns with the mid-session consolidation zone observed during Thursday's rally. If the index breaks below 24,212 on a 15-minute closing basis, Downside Target 1 (D1) at 24,051 comes into focus — this level sits near the session open and represents the gap-fill zone. Further weakness below D1 could drag prices to Downside Target 2 (D2) at 23,928 and Downside Target 3 (D3) at 23,828.
The Nifty Analysis from a technical standpoint shows the index has reclaimed its short-term moving averages. The 9-EMA and 21-EMA on the hourly chart are now positively aligned, and the RSI has moved into the 62-65 range, indicating bullish momentum without immediate overbought conditions. MACD on the daily timeframe has turned positive with the signal line crossover confirming upward momentum. Volume during Thursday's rally was above the 20-day average, lending credibility to the breakout attempt.
The Nifty Outlook for Monday is constructive. With GIFT Nifty at 24,342 suggesting a flat start, the index may consolidate briefly near resistance before making its directional move. A key technical observation is that the previous resistance near 24,200-24,250 has now been converted into a support zone, which is a classic polarity change pattern that strengthens the bullish argument.
Bank Nifty Analysis and Bank Nifty Prediction for 20-07-2026
Technical Analysis | Support & Resistance | Bank Nifty Outlook
Current price sits at 89% of the support-to-resistance range — strongly bullish
Bank Nifty was the undeniable star of Thursday's session, soaring 939.15 points to close at 58,521.40. The index opened at 57,662.00 and staged a relentless march higher throughout the day, touching a high of 58,596.85 — perfectly kissing the resistance level at 58,596. This was a textbook rally fueled by broad-based strength across private banking heavyweights, which collectively drove the index higher with above-average turnover.
The Bank Nifty Prediction for 20-07-2026 hinges on whether the index can sustain above its resistance at 58,596. Thursday's session saw the high at 58,596.85, meaning resistance was not just tested — it was marginally breached intraday. A sustained 15-minute close above 58,596 on Monday would be a decisive breakout signal, targeting Upside Target 1 (U1) at 59,000, followed by U2 at 59,275 and the ambitious U3 at 59,541.
Support at 57,915 is the key floor for the Bank Nifty Analysis. This level represents the zone where fresh buying interest emerged during Thursday's mid-session consolidation. If Bank Nifty opens below 58,000 and slips under 57,915 on a closing basis, traders should look for D1 at 57,632, D2 at 57,302, and D3 at 56,698 as sequential downside targets.
The Bank Nifty PCR at 1.01 is notably neutral compared to Nifty's bullish 1.62 reading. This suggests that options writers are more evenly split on Bank Nifty's direction, and the index could see sharper intraday whipsaws if institutional positioning shifts quickly. The daily RSI at around 64-66 is healthy and trending upward, and MACD histogram bars are expanding, confirming accelerating momentum.
False breakout caution is particularly relevant for Bank Nifty. Given the close proximity to resistance, a 15-minute candle that pierces 58,596 but fails to sustain could trigger aggressive profit-taking, dragging the index toward support at 57,915 first, then D1 at 57,632 and D2/D3 below. Traders should wait for confirmation before committing to directional bets on either side.
Sensex Analysis and Sensex Prediction for 20-07-2026
Technical Analysis | Support & Resistance | Sensex Outlook
Current price sits at 74% of the support-to-resistance range — leaning bullish
Sensex delivered a strong performance on 17 July, gaining 964.58 points to close at 78,151.45. The index opened at 77,370.77, dipped briefly to a low of 77,308.00 in the first few minutes, and then rallied steadily to test the day's high at 78,282.55 — which perfectly coincides with the resistance level at 78,282. This close-to-high finish signals that sellers were absent in the final hour and bullish momentum carried through to the closing bell.
For the Sensex Prediction on 20-07-2026, resistance at 78,282 is the immediate barrier. With Thursday's high touching 78,282.55, this level has effectively been tested. A clean breakout above 78,282 with follow-through buying could push Sensex toward Upside Target 1 (U1) at 78,670, then U2 at 79,028, and U3 at 79,372. The U3 level at 79,372 would bring the index tantalizingly close to the psychologically important 80,000 mark.
Support at 77,785 for the Sensex Analysis is significant because it represents the level where institutional buying interest was visible during Thursday's session. A break below 77,785 would bring D1 at 77,164 into play, followed by D2 at 76,858 and D3 at 76,497. The Sensex Outlook is cautiously optimistic, with the index needing to clear its resistance for continued momentum.
The daily chart shows a large bullish marubozu-like candle with a minimal lower wick, which is a strong continuation pattern. The index has recovered above its 50-day EMA and is approaching its 20-day EMA from below, which could act as dynamic resistance near the 78,300-78,400 zone. A weekly close above 78,282 would be structurally significant for the broader market prediction.
📊 Support & Resistance Comparison — All Indices
| Index | Support | Resistance | U1 | U2 | U3 | D1 | D2 | D3 |
|---|---|---|---|---|---|---|---|---|
| Nifty | 24,212 | 24,368 | 24,473 | 24,530 | 24,600 | 24,051 | 23,928 | 23,828 |
| Bank Nifty | 57,915 | 58,596 | 59,000 | 59,275 | 59,541 | 57,632 | 57,302 | 56,698 |
| Sensex | 77,785 | 78,282 | 78,670 | 79,028 | 79,372 | 77,164 | 76,858 | 76,497 |
Derivative Market Analysis — Option Chain Analysis, PCR Analysis & OI Analysis
Nifty PCR Analysis
PCR above 1.5 signals heavy put writing. Bulls have strong backing from options sellers defending the 24,200 support. This is a reliably bullish derivative signal for Nifty Prediction.
Bank Nifty PCR Analysis
PCR near 1.0 shows balanced call and put writing. Neither side has decisive control. Bank Nifty is more susceptible to sharp directional moves once the balance tips.
The Derivative Market Analysis for 20-07-2026 reveals interesting divergences across index derivatives. Nifty's PCR at 1.62 is deeply bullish territory — put writers have aggressively sold puts at and below 24,200, creating a strong floor of support that they will defend. This Option Chain Analysis suggests that the 24,200 put strike likely has the highest put open interest (OI), forming a wall of support that makes a sharp break below 24,200 improbable unless there is a significant macro shock.
On the call side, the 24,400 and 24,500 strikes are expected to have the highest call OI, creating resistance bands at those levels. As the index approaches these strikes, call writers will exert selling pressure, creating friction for the upside. However, if fresh call writing unwinds (indicated by falling call OI with rising prices), it would confirm genuine buying and open the door for U2 and U3 targets.
Bank Nifty's PCR at 1.01 reflects an equilibrium in the options market. This neutrality can be deceptive — it often precedes a sharp directional move once institutional positioning shifts. The 58,500-59,000 call strikes and 58,000-57,500 put strikes are likely the key OI concentration zones. The OI Analysis suggests that a break above 59,000 would trigger significant call unwinding, creating a short-covering rally that could rapidly push Bank Nifty toward U2 at 59,275.
India VIX at 13.235 is a favorable signal for premium sellers and directional traders alike. Low implied volatility means options premiums are relatively cheap, making it an opportune time for buying options for directional bets while managing risk through defined-risk strategies. However, traders should be aware that a VIX spike from these levels could occur if global triggers emerge, which would invalidate premium-selling strategies.
Technical Market Outlook — Chart Pattern & Indicator Analysis
The Technical Market Outlook for the Indian Stock Market heading into 20-07-2026 is constructive across all three benchmark indices. Thursday's session printed strong bullish candles on daily charts for Nifty, Bank Nifty, and Sensex, with all three closing near their intraday highs. This close-to-high finish pattern is one of the strongest technical signals of buyer conviction.
On the Nifty daily chart, the candle formed on 17 July is a near-marubozu pattern — characterized by a long real body, a small lower wick, and virtually no upper wick. This pattern indicates that buyers dominated the entire session from open to close. The index has now reclaimed its 9-EMA and 21-EMA on both the daily and hourly timeframes, establishing a positive alignment that favors continued upside.
The RSI (Relative Strength Index) on the daily chart sits in the 62-65 range across all three indices, which is in the bullish zone without being overbought. RSI values above 60 but below 70 are the sweet spot for continuation trades — they confirm that momentum is positive but that there is still room for the rally to extend before hitting overbought conditions near 70-75.
MACD (Moving Average Convergence Divergence) has turned positive for Nifty with the MACD line crossing above the signal line. The histogram bars are expanding, confirming accelerating bullish momentum. Bank Nifty's MACD shows an even stronger bullish signal, with a wider gap between the MACD and signal lines reflecting the index's outsized 1.63% rally.
Bollinger Bands analysis shows that all three indices have moved from the lower band region toward the middle and upper bands, indicating a volatility expansion in the bullish direction. The 20-day moving average, which serves as the Bollinger midline, is now being used as dynamic support for Nifty near 24,100-24,150.
Volume analysis is critical — Thursday's trading volumes were above the 20-day average, which validates the price move and suggests institutional participation. Without volume confirmation, breakouts often fail, but Thursday's rally passed this crucial test.
Market Analysis and Market Prediction — Indian Stock Market Outlook
The broader Market Analysis for the Indian Stock Market points to a continuation of the constructive tone heading into the next trading session. The Market Prediction for 20-07-2026 is shaped by both domestic momentum and global cues. GIFT Nifty trading at 24,342 is nearly flat to Thursday's close, suggesting that overnight global developments have not disrupted the positive sentiment built during the previous session.
Global cues are supportive. US market futures show Dow Jones Futures at 52,225, S&P 500 Futures at 7,474, and Nasdaq Futures at 28,581, all holding positive territory. The strength in US technology stocks, reflected by Nasdaq Futures holding above 28,500, bodes well for Indian IT stocks and, by extension, the broader index performance.
Asian markets are contributing positive signals with Nikkei Futures at 64,245 and Hang Seng Futures at 24,543. The broader Asian market strength suggests that global risk appetite remains healthy, which traditionally supports emerging market equities including India.
On the macro front, Brent Crude at $85.63 deserves close monitoring. Oil prices at these levels represent a mild headwind for India, given the country's status as a major crude importer. However, the current price is not at levels that would trigger panic — it would take a sustained move above $90 to materially impact market sentiment.
The USD/INR exchange rate at 96.37 reflects an elevated dollar, which creates challenges for foreign investors looking at India but also supports export-oriented sectors. The rupee's weakness has been orderly and managed by the RBI, so sudden disruptive moves are unlikely in the near term.
The Tomorrow Market Prediction from Option Matrix India leans toward a mildly bullish bias for Monday's session, with the important caveat that all three indices need to sustain above their respective resistance levels for the upside targets to activate. The Stock Market Prediction framework is probability-based — if resistance holds and fails, the range-bound or bearish scenarios come into play.
The Share Market Prediction also considers the fact that Bank Nifty outperformed both Nifty and Sensex on Thursday, gaining 1.63% versus Nifty's 1.09% and Sensex's 1.25%. This relative outperformance by banking stocks suggests that the financial sector is leading the market rally, which is typically a healthy sign for broad market advances. When banks lead, the rally tends to have broader participation and sustainability.
Trading Strategy for 20-07-2026
Bullish Scenario
Entry: Nifty sustains above 24,368 on 15-minute close.
Targets: U1: 24,473 → U2: 24,530 → U3: 24,600
Stop-Loss: 24,212 (support level)
Booking: 70% at 24,473, 15% at 24,530, 15% at 24,600 with trailing SL.
Bearish Scenario
Entry: Nifty breaks below 24,212 on 15-minute close.
Targets: D1: 24,051 → D2: 23,928 → D3: 23,828
Stop-Loss: 24,368 (resistance level)
Booking: 70% at 24,051, 15% at 23,928, 15% at 23,828 with trailing SL.
Range-Bound Scenario
Zone: Nifty trades between 24,212 and 24,368.
Strategy: Scalp within range, sell near resistance, buy near support.
Stop-Loss: Tight SL on both sides (20-30 points beyond range).
Alert: Wait for a confirmed breakout for positional trades.
False Breakout and False Breakdown Strategy Note: One of the most common traps in intraday trading is the false breakout. If a 15-minute candle closes above resistance at 24,368 but the next candle fails to sustain above this level, it constitutes a false breakout. In this scenario, the first downside reaction target is the support at 24,212, followed by Downside Target 1 (D1) at 24,051 and subsequently D2 at 23,928 or D3 at 23,828.
Conversely, a false breakdown occurs when a 15-minute candle closes below support at 24,212 but fails to sustain. The first upside reaction target would be the resistance at 24,368, followed by Upside Target 1 (U1) at 24,473 and then U2/U3. False signals are particularly common during the first 30 minutes of trading and during the lunch session. Experienced traders at Option Matrix India recommend waiting for confirmation on the second candle before committing capital.
Gap-Up/Gap-Down Risk Warning: In a big gap-up or gap-down session, most of the supplied support, resistance, and target levels can become invalid quickly. These levels are calculated based on the previous session's price structure and are designed for normal opening conditions. If Nifty opens more than 100 points above resistance or below support, traders should recalibrate their levels using the first 15-minute high and low as the new reference range. Treat all supplied levels as strategic probability zones rather than guaranteed outcome lines.
Disciplined Profit-Booking Framework: Option Matrix India recommends a structured profit-booking approach for all intraday trades. Always book 70% of your position at the first target — this locks in the majority of profits and removes psychological pressure. Then book 15% at the second target and trail the remaining 15% toward the third target with a stop-loss moved to breakeven. This framework ensures consistent P&L even when markets reverse from extended target zones.
Overall Market Sentiment
Current Sentiment: Constructive to Mildly Bullish
🛠 Useful Tools and Resources
Frequently Asked Questions — Market Prediction for 20-07-2026
What is the Nifty Prediction for 20-07-2026?
Nifty has support at 24,212 and resistance at 24,368 for 20-07-2026. If it sustains above 24,368, upside targets are 24,473 (U1), 24,530 (U2), and 24,600 (U3). Below 24,212, downside targets are 24,051 (D1), 23,928 (D2), and 23,828 (D3). The Nifty Outlook is mildly bullish with PCR at 1.62.
What is the Bank Nifty Prediction for tomorrow?
Bank Nifty has support at 57,915 and resistance at 58,596 for 20-07-2026. The Bank Nifty Prediction is bullish above 58,596 with targets at 59,000, 59,275, and 59,541. Bank Nifty closed at 58,521.40 with a strong 1.63% gain, and the Bank Nifty PCR at 1.01 suggests balanced positioning.
What is the Sensex Prediction for 20 July 2026?
Sensex support is at 77,785 and resistance at 78,282. Upside targets are 78,670, 79,028, and 79,372. Downside targets are 77,164, 76,858, and 76,497. The Sensex closed at 78,151.45 near its day high, signaling positive momentum for the next session.
What does the India VIX at 13.235 mean for trading?
India VIX at 13.235 indicates low implied volatility. This is favorable for directional trades as option premiums are cheaper, and it suggests that the market does not expect a sharp move. However, a sudden VIX spike from these low levels can catch traders off guard, so position sizing and stop-losses remain essential.
How should I book profits using the target levels?
Option Matrix India recommends booking 70% of profits at the first target (U1 or D1), 15% at the second target (U2 or D2), and trailing the remaining 15% toward the third target (U3 or D3) with a stop-loss moved to breakeven. This disciplined approach protects gains while allowing participation in extended moves.
What is the significance of Nifty PCR at 1.62?
A Nifty PCR of 1.62 means there are 1.62 puts written for every call. This is a strongly bullish signal in derivative market analysis, indicating that options writers are heavily selling puts and expecting support to hold. It suggests that 24,200 is a strong floor for Nifty in the near term.
What are the global market cues for Indian markets on Monday?
Global cues are mixed-to-positive. GIFT Nifty at 24,342 suggests a flat opening. Dow Futures at 52,225, S&P 500 Futures at 7,474, and Nasdaq Futures at 28,581 are all in positive territory. Asian markets (Nikkei 64,245, Hang Seng 24,543) are supportive. Brent Crude at $85.63 and USD/INR at 96.37 are the key macro variables to monitor.
What is a false breakout and how should I trade it?
A false breakout occurs when price pierces resistance on a 15-minute candle but fails to sustain above it. In this case, the first downside reaction goes toward the support level, then to D1 and D2/D3. Similarly, a false breakdown below support leads to a reaction toward resistance and then U1/U2. Always wait for the second candle to confirm before taking a position based on a breakout or breakdown.
Disclaimer: This article is published by Option Matrix India for educational and informational purposes only. It does not constitute financial advice, investment recommendation, or solicitation to buy or sell any securities. Stock market trading involves substantial risk of loss and is not suitable for all investors. The technical analysis, support, resistance, and target levels mentioned are probability-based estimates derived from historical price action and derivative data. Past performance is not indicative of future results. Always consult a SEBI-registered financial advisor before making investment decisions. Option Matrix India and its contributors are not liable for any losses incurred based on the information provided in this article.