Technical Analysis for 21 July 2025: Nifty 50 and Bank Nifty Predictions
Welcome to Option Matrix India’s in-depth technical analysis for the Indian stock market, focusing on the Nifty 50 and Bank Nifty indices for the trading session on July 21, 2025. This article provides a comprehensive look at recent market movements, key technical levels, and trading strategies to help you navigate the upcoming session. With a bearish close on July 18, 2025, and mixed global cues, traders need to approach the market with caution and precision. Our analysis leverages technical indicators, candlestick patterns, and global market influences to offer actionable insights for both novice and experienced traders.
Market Overview: July 18
On July 18, 2025, the Indian stock market closed on a bearish note, reflecting continued selling pressure. The Nifty 50 index opened at 25,108.55, reached a high of 25,144.6, dipped to a low of 24,918.65, and settled at 24,968.4. This closing was below the previous day’s close of 25,111.45, confirming a downward trend. Similarly, the Bank Nifty index opened at 56,524.25, peaked at 56,705.15, fell to 56,204, and closed at 56,283, down from the previous close of 56,828.8.
Our previous market prediction for July 14, 2025, was remarkably accurate, with the market moving precisely as anticipated. For a detailed review, check our analysis here: Market Prediction for July 18, 2025.
Key Observations of Market Closing
The market’s performance on July 18 provides critical insights for traders preparing for July 21. Here are the key observations:
- Nifty 50 Performance: The index closed at 24,968.4, down 143.05 points from 25,111.45, signaling bearish sentiment. It traded within a range of 24,918.65 to 25,144.6, indicating intraday volatility.
- Bank Nifty Performance: Bank Nifty closed at 56,283, a decline of 545.8 points from 56,828.8, with a trading range of 56,204 to 56,705.15.
- Global Cues: Crude oil prices rose from $66.7 to $68.3 per barrel, suggesting potential inflationary pressures. The Indian Rupee weakened slightly from 86.08 to 86.167 against the US dollar. European markets showed a flat to bullish trend, while Dow futures remained flat, reflecting mixed global sentiment.
- Market Sentiment: External factors, such as concerns over US tariff policies and escalating tensions in the Middle East, likely contributed to the bearish mood in the Indian market, as noted in recent market reports .
Market Closing Data - July 18, 2025
Nifty 50
◉ Open: 25,108.55
◉ High: 25,144.60
◉ Low: 24,918.65
◉ Close: 24,968.40
◉ Previous Close: 25,111.45
◉ Change: -143.05
Bank Nifty
◉ Open: 56,524.25
◉ High: 56,705.15
◉ Low: 56,204.00
◉ Close: 56,283.00
◉ Previous Close: 56,828.80
◉ Change: -545.80
Daily Candle Pattern
On July 18, 2025, the Nifty 50 formed a bearish candlestick, closing lower than its opening price. This red candle, with a small upper wick and a longer lower wick, indicates that after an initial attempt to move higher, sellers dominated, pushing the index to close near its daily low. This pattern reflects strong selling pressure and suggests that bearish momentum may persist unless a reversal signal emerges.
Understanding Candlestick Patterns
Candlestick charts are a cornerstone of technical analysis, offering visual insights into market sentiment. Each candlestick represents a specific time period, showing the open, high, low, and close prices. Common patterns include:
- Bullish Engulfing: Signals a potential reversal from a downtrend to an uptrend.
- Bearish Engulfing: Indicates a possible shift from an uptrend to a downtrend.
- Doji: Represents market indecision, often seen at key turning points.
The bearish candle on July 18 aligns with the broader market’s downward trend, reinforcing the need for cautious trading strategies.
Technical Analysis: Nifty 50
The Nifty 50 is currently trading below its short-term moving averages, indicating a bearish trend. The index has breached the psychological support level of 25,000, with the next key support zone at 24,950–24,800, as noted by market analysts . Resistance is observed at 25,000–25,050.
Key Levels to Watch:
- Resistance: 25,000–25,050
- Support: 24,950–24,800
A sustained move above 25,050 could signal a potential recovery towards 25,150–25,200. Conversely, a break below 24,950 may lead to further declines towards 24,700 or lower.
Trading Strategy for Nifty 50
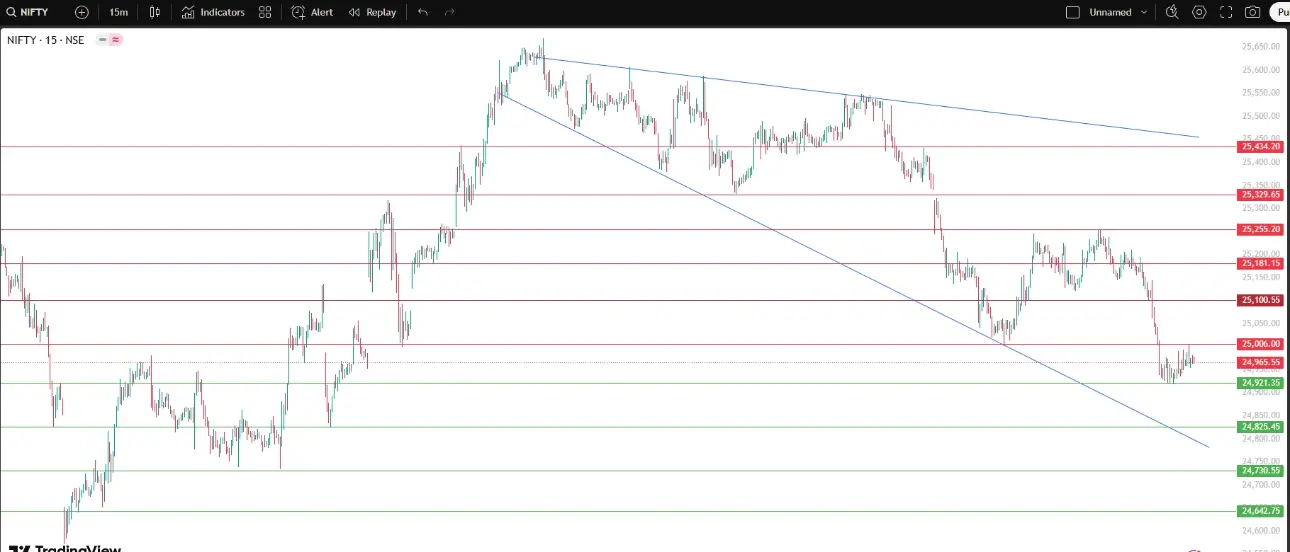
Our analysis identifies a no-trading zone between 24,920 and 25,006 to avoid false breakouts. Here’s the trading plan based on 15-minute candlestick closes:
- Bullish Scenario: If the 15-minute candle closes above 25,006, initiate long positions with targets at 25,100, 25,180, and 25,250.
- Bearish Scenario: If the 15-minute candle closes below 24,920, consider short positions with targets at 24,825, 24,730, and 24,640.
- Reversal Scenario: If the index crosses 24,918 but the 15-minute candle closes above it, expect upside targets at 24,970 and 25,150.
- Short-Term Pullback: If the index crosses 25,006 but closes below it on a 15-minute candle, short with targets at 24,930 (day’s low) and 24,850.
Important Rule: Do not initiate bullish trades in bearish candles or bearish trades in bullish candles to minimize risk.

Nifty 50 Trading Levels (July 21, 2025)
📈 Bullish (Long)
Trigger: Close above 25,006
✅ Target 1: 25,100
✅ Target 2: 25,180
✅ Target 3: 25,250
📉 Bearish (Short)
Trigger: Close below 24,920
✅ Target 1: 24,825
✅ Target 2: 24,730
✅ Target 3: 24,640
🔄 Reversal (Upside)
Trigger: Cross 24,918, close above
✅ Target 1: 24,970
✅ Target 2: 25,150
⏸️ Short-Term Pullback (Short)
Trigger: Cross 25,006, close below
✅ Target 1: 24,930
✅ Target 2: 24,850
Bank Nifty Predictions
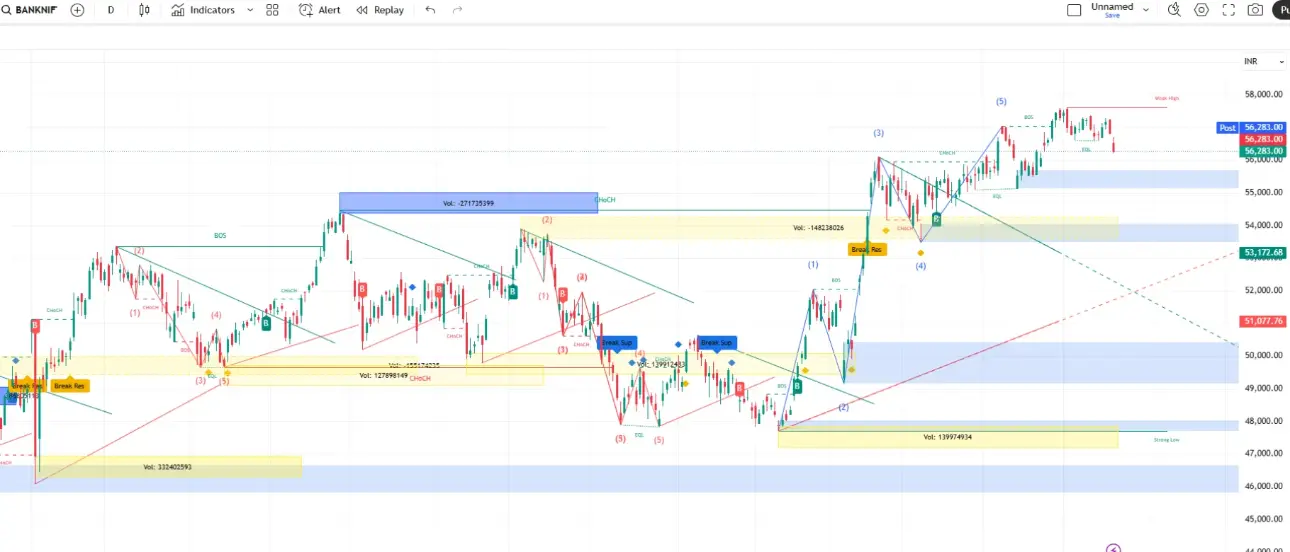
The Bank Nifty index mirrored the Nifty 50’s weakness, closing at 56,283 after a volatile session. Key support levels are at 56,200 and 56,000, while resistance is at 56,500 and 56,700. The banking sector faced pressure, potentially due to disappointing earnings from key constituents, as seen in recent market trends.
Trading Strategy for Bank Nifty
- Support Levels: 56,200, 56,000
- Resistance Levels: 56,500, 56,700
Traders should monitor for breakouts above 56,500 for bullish opportunities or breakdowns below 56,200 for bearish trades. Given the bearish candle on July 18, focus on short-term support levels for potential entry points.

Bank Nifty Key Levels for July 21, 2025
| Level Type | Price |
|---|---|
| Support 1 | 56,200 |
| Support 2 | 56,000 |
| Resistance 1 | 56,500 |
| Resistance 2 | 56,700 |
Tomorrow’s Market Prediction (July 21, 2025)
Based on the technical setup and market conditions on July 18, the Indian stock market may open flat to negative on July 21, 2025. The initial 15-minute candle will be critical in determining the day’s trend. For Nifty 50, a break above 25,006 could signal bullish momentum, while a drop below 24,920 may trigger further selling. Bank Nifty traders should watch for similar breakout or breakdown signals at 56,500 and 56,200, respectively.
Global factors, including a rise in crude oil prices to $68.3 per barrel and a slightly weaker Rupee at 86.167, may add to market caution. Additionally, weekend developments in global markets, such as US policy announcements or geopolitical events, could influence the opening sentiment.
Importance of Technical Analysis
Technical analysis is a powerful tool for traders, enabling them to evaluate securities based on historical price and volume data. By identifying trends, support and resistance levels, and chart patterns, traders can make informed decisions about entry and exit points. Tools like moving averages, Relative Strength Index (RSI), and candlestick patterns provide insights into market momentum and potential reversals, making technical analysis indispensable for navigating volatile markets like the Indian stock market.
Understanding the 15-Minute Candle
The 15-minute candlestick is a vital tool for intraday traders. Each candle encapsulates 15 minutes of price action, showing the open, high, low, and close prices. A close above a key resistance level on a 15-minute chart can signal a breakout, while a close below support may indicate a breakdown. Our trading strategies for Nifty 50 rely on 15-minute candle closes to confirm entry and exit points, ensuring disciplined and objective trading.
Risk Management in Trading
Effective risk management is the backbone of successful trading. Traders should always use stop-loss orders to limit potential losses and adhere to position sizing based on their risk tolerance. For example, our Nifty trading strategy includes specific stop-loss levels to protect against adverse price movements. Emotional discipline is equally important—avoiding impulsive decisions driven by fear or greed can significantly improve trading outcomes.
Global Market Influences
The Indian stock market is closely tied to global economic trends. Rising crude oil prices, as seen with the increase to $68.3 per barrel, can pressure inflation-sensitive sectors. A weaker Rupee at 86.167 may impact import-dependent industries. Mixed signals from European markets (flat to bullish) and flat Dow futures suggest uncertainty, while concerns over US tariff policies and Middle East tensions add to global volatility . Traders should stay informed about these developments to anticipate market reactions.
Sectoral Insights
While specific sectoral performance data for July 18, 2025, is limited, recent trends indicate that the IT sector faced selling pressure following disappointing earnings from companies like TCS, while sectors like metals showed resilience . Traders should monitor sector-specific news and earnings reports for potential opportunities on July 21.
Trading Psychology
Maintaining emotional discipline is critical in volatile markets. Fear of missing out or panic during downturns can lead to poor decisions. By adhering to a well-defined trading plan, such as the one outlined for Nifty 50, traders can avoid emotional pitfalls and focus on objective analysis. Sticking to predefined levels and risk management rules ensures consistency and long-term success.
Final Verdict
The bearish close on July 18, 2025, signals caution for the trading session on July 21, 2025. For Nifty 50, traders should focus on the no-trading zone between 24,920 and 25,006, initiating trades only on confirmed 15-minute candle closes above or below these levels. Bank Nifty traders should watch support at 56,200 and resistance at 56,500 for directional cues. Disciplined trading, coupled with proper risk management, will be key to navigating the market’s current volatility.
Disclaimer: The views and opinions expressed in this article are for informational purposes only and do not constitute financial advice. Please conduct your own research or consult a financial advisor before making any investment decisions.