Technical Analysis for 24 Sept 2025:
Nifty, Bank Nifty & Sensex Prediction
By Option Matrix India | Your Trusted Technical Analysis Partner
Published: 23rd September 2025
The Indian stock market presents a mixed but cautiously optimistic outlook for September 24, 2025, following yesterday's consolidation phase. Our comprehensive technical analysis reveals that major indices are positioned at crucial levels, with Nifty predictions suggesting a sideways to mildly bullish bias, while Bank Nifty predictions indicate potential for upward momentum. The Sensex predictions show strong support holding at key psychological levels, backed by robust derivatives trading activity and detailed options chain analysis.

The National Stock Exchange (NSE) building representing the hub of the Indian stock market
Key Market Highlights for Tomorrow:
- Nifty 50 trading in crucial range of 25,000-25,150 with maximum options activity
- Bank Nifty showing signs of recovery above 55,400 levels with strong put writing
- Sensex maintaining support at 82,000 psychological barrier with institutional backing
- Mixed FII-DII data with domestic institutions showing strong buying interest in derivatives trading
Market Overview and Key Takeaways
Based on comprehensive market analysis for tomorrow, the Indian indices are positioned at critical junctures. The options chain analysis reveals significant put writing at lower levels, indicating institutional confidence in current support zones. Our market prediction models suggest a cautious approach with defined risk-reward scenarios for both bulls and bears.
Critical Market Drivers:
- FII selling pressure of ₹3,500 crores partially offset by DII buying
- Options chain analysis showing Put-Call Ratio at 0.86, indicating mild bearish sentiment
- Gift Nifty trading flat around 25,247, suggesting sideways opening
- Global markets showing mixed signals with US indices marginally positive
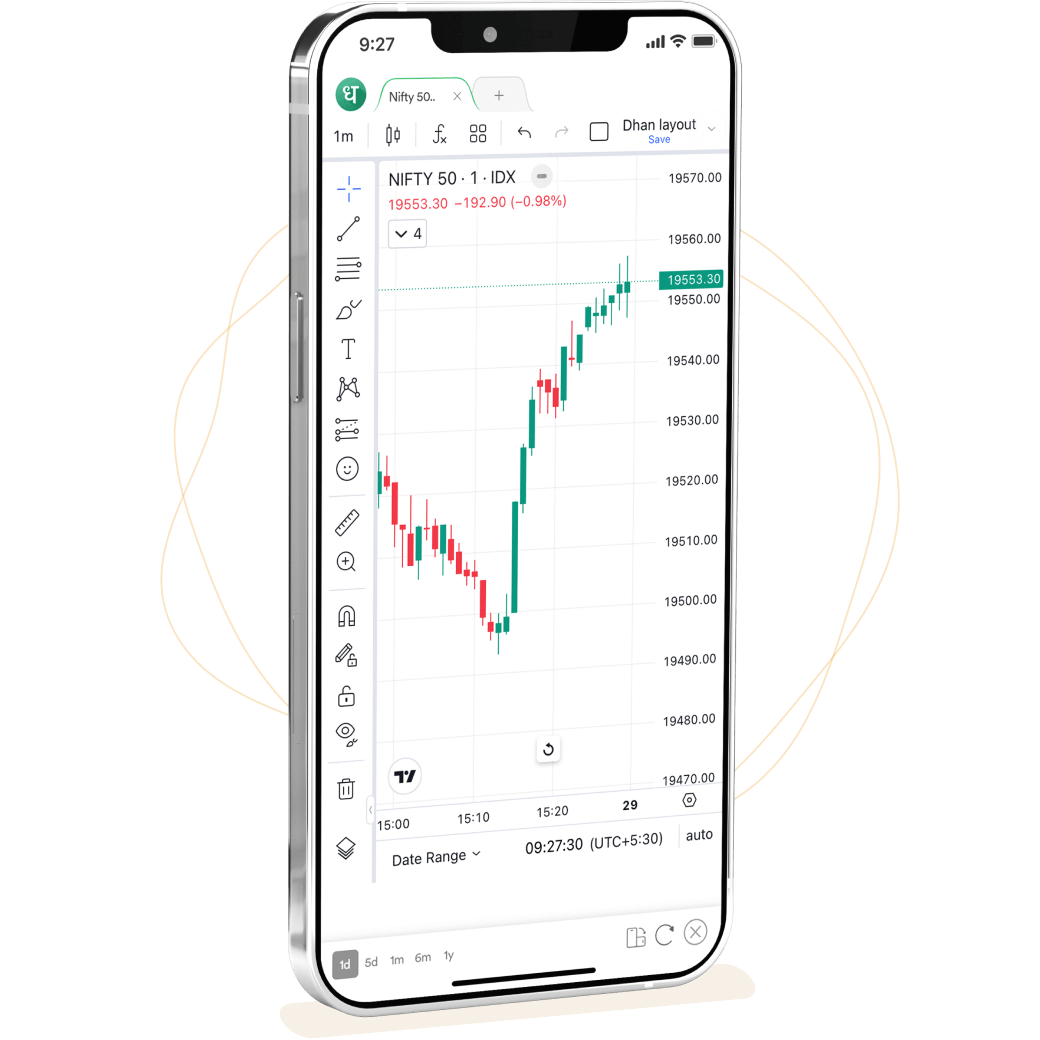
Mobile screen showing the Dhan Trading App with Nifty 50 candlestick chart for technical analysis of Indian stock market trends dhan
Detailed Nifty 50 Technical Analysis
Current Market Structure and Support and Resistance Levels
The Nifty has completed a healthy retracement to its 20-day exponential moving average, indicating a normal correction within the broader uptrend. The W-pattern breakout level has been successfully retested, providing a solid foundation for potential upward movement. Our technical analysis confirms that the index is trading within a critical decision zone.
Critical Support and Resistance Framework:
Primary Support Structure:
- Immediate Support: 25,000 (Psychological level with maximum Put writing of 41 points premium)
- Secondary Support: 24,980 (Previous resistance turned support zone)
- Major Support: 24,800 (Strong institutional demand and derivatives trading interest)
- Extended Support: 24,700 (Weekly chart support confluence)
Resistance Architecture:
- Immediate Resistance: 25,150 (W-pattern breakout level - crucial for bulls)
- Next Resistance: 25,261 (15-minute breakout trigger level)
- Major Resistance: 25,330-25,368 (Previous swing highs with call writing)
- Extended Target: 25,450 (Weekly resistance and profit booking zone)
Market Analysis for Tomorrow - 24 September
Nifty Predictions
Bullish Scenario (High Probability):
A 15-minute closing above 25,261 would trigger institutional buying with measured targets:
- Target 1: 25,317 (Book 60% positions)
- Target 2: 25,368 (Scale out remaining 40%)
- Extended Target: 25,450 (Hold only core positions)
- Stop Loss: 25,184 (Previous day's closing)
Bearish Scenario (Moderate Probability):
Sustained break below 25,000 with 15-minute confirmation could trigger:
- Target 1: 24,967 (Previous support turned resistance)
- Target 2: 24,800 (Major institutional demand zone)
- Stop Loss: 25,050 (Failed breakdown level)
Neutral Zone Trading (Current Scenario):
The 25,000-25,150 range represents a no-trading zone where market prediction suggests continued consolidation.
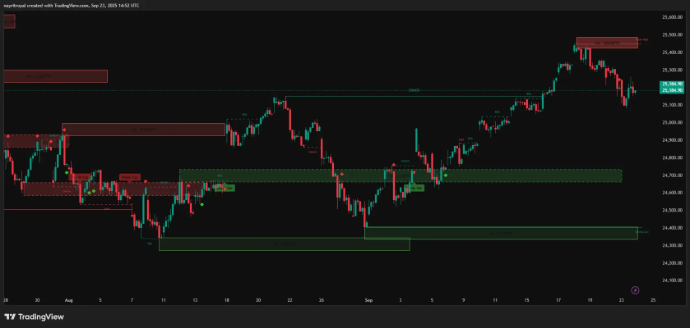
The Nifty 1-hour candlestick chart illustrates that the Nifty index continues to exhibit a short-term downtrend.
Bank Nifty Predictions and Comprehensive Analysis
Advanced Technical Setup
Bank Nifty has demonstrated exceptional resilience with a strong recovery from triple bottom formation around 55,000 levels. The derivatives trading data shows significant unwinding of short positions, while options chain analysis reveals concentrated put writing at crucial support levels, indicating institutional confidence in the banking sector's near-term outlook.
Detailed Support and Resistance Matrix:
Multi-layered Support Structure:
- Critical Support: 55,317 (Triple bottom formation with high delivery percentage)
- Immediate Support: 55,474 (Intraday pivot level)
- Strong Support: 54,917 (Previous swing low with institutional accumulation)
- Major Support: 54,800 (Daily chart support zone and psychological level)
- Extended Support: 54,600 (Weekly chart demand zone)
Comprehensive Resistance Framework:
- Immediate Resistance: 55,688 (Key breakout level for sustained rally)
- Primary Target: 55,835 (Fibonacci extension 61.8% level)
- Major Target: 56,000 (Psychological resistance with heavy call writing)
- Extended Target: 56,151 (Previous weekly high and institutional profit booking)
- Ultimate Target: 56,300 (Monthly resistance and gap fill level)
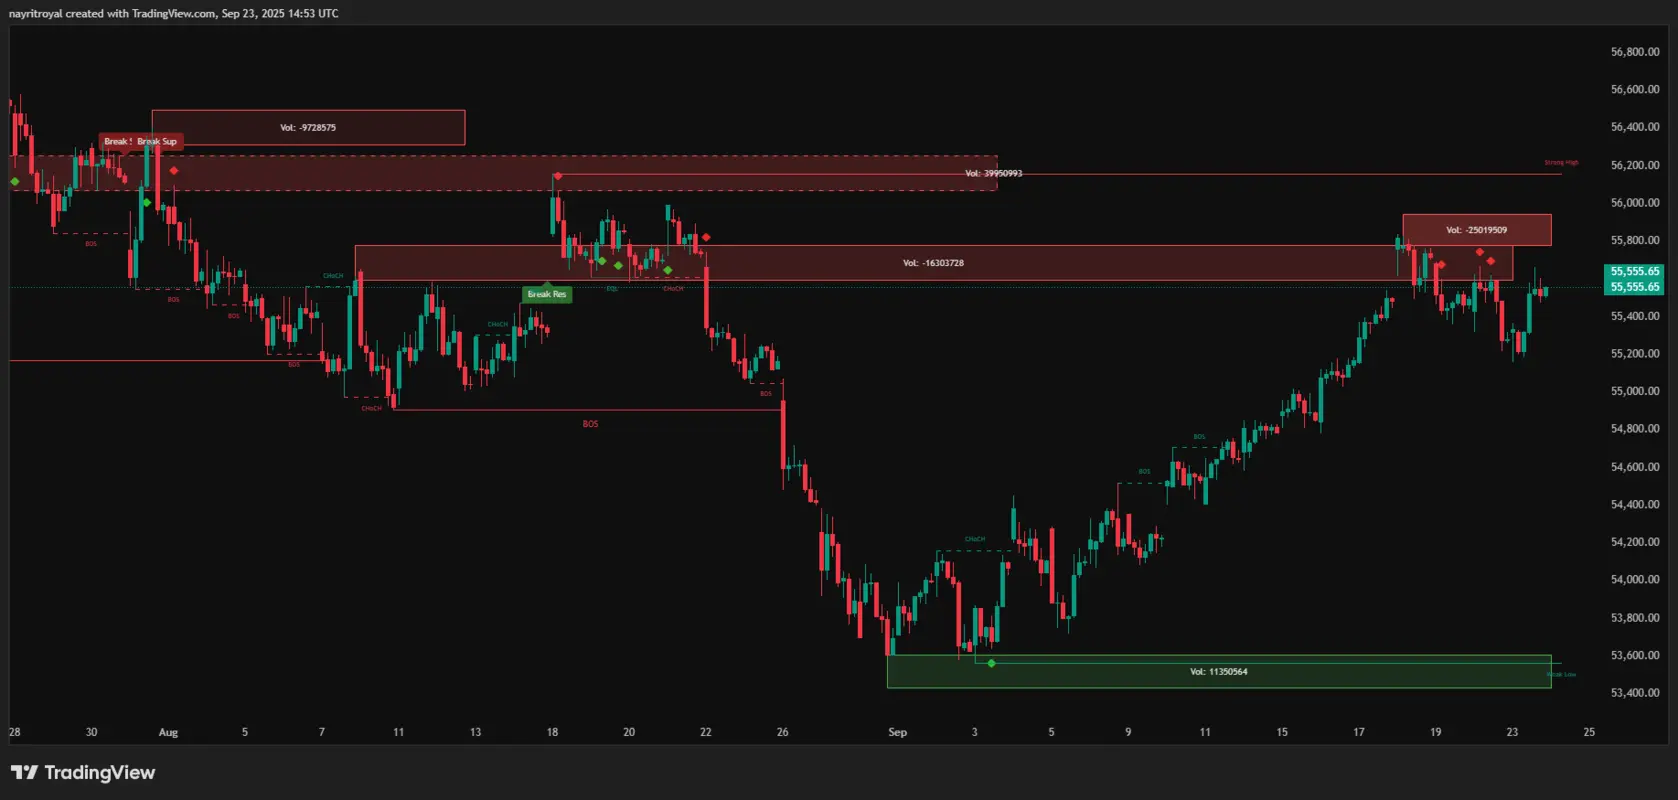
Bank Nifty 1hr Chart
Advanced Derivatives Trading Strategy for Bank Nifty
Long Setup (Recommended Approach):
Entry Criteria: 15-minute closing above 55,688 with volume confirmation
- Position Size: 2% of capital with 1:3 risk-reward ratio
- Target Distribution: 55,835 (70% booking), 56,000 (30% booking)
- Stop Loss: 55,474 (Strict adherence required)
- Time Frame: Intraday to 2-day holding period
Short Setup (Counter-trend opportunity):
Entry Criteria: Rejection from 55,688 without decisive breakout
- Entry: Below 55,474 with 15-minute confirmation
- Target 1: 55,317 (Primary profit booking - 80% quantity)
- Target 2: 54,917 (Extended target - 20% quantity)
- Stop Loss: 55,750 (Failed breakdown invalidation)
Sensex Predictions & Technical Analysis
The Sensex has demonstrated remarkable institutional support at the crucial 82,000 level, with our technical analysis confirming this as a major demand zone. The index has successfully completed its retracement to the 20-day EMA and shows signs of base building. The W-pattern breakout retracement appears complete, providing a healthy foundation for potential recovery.
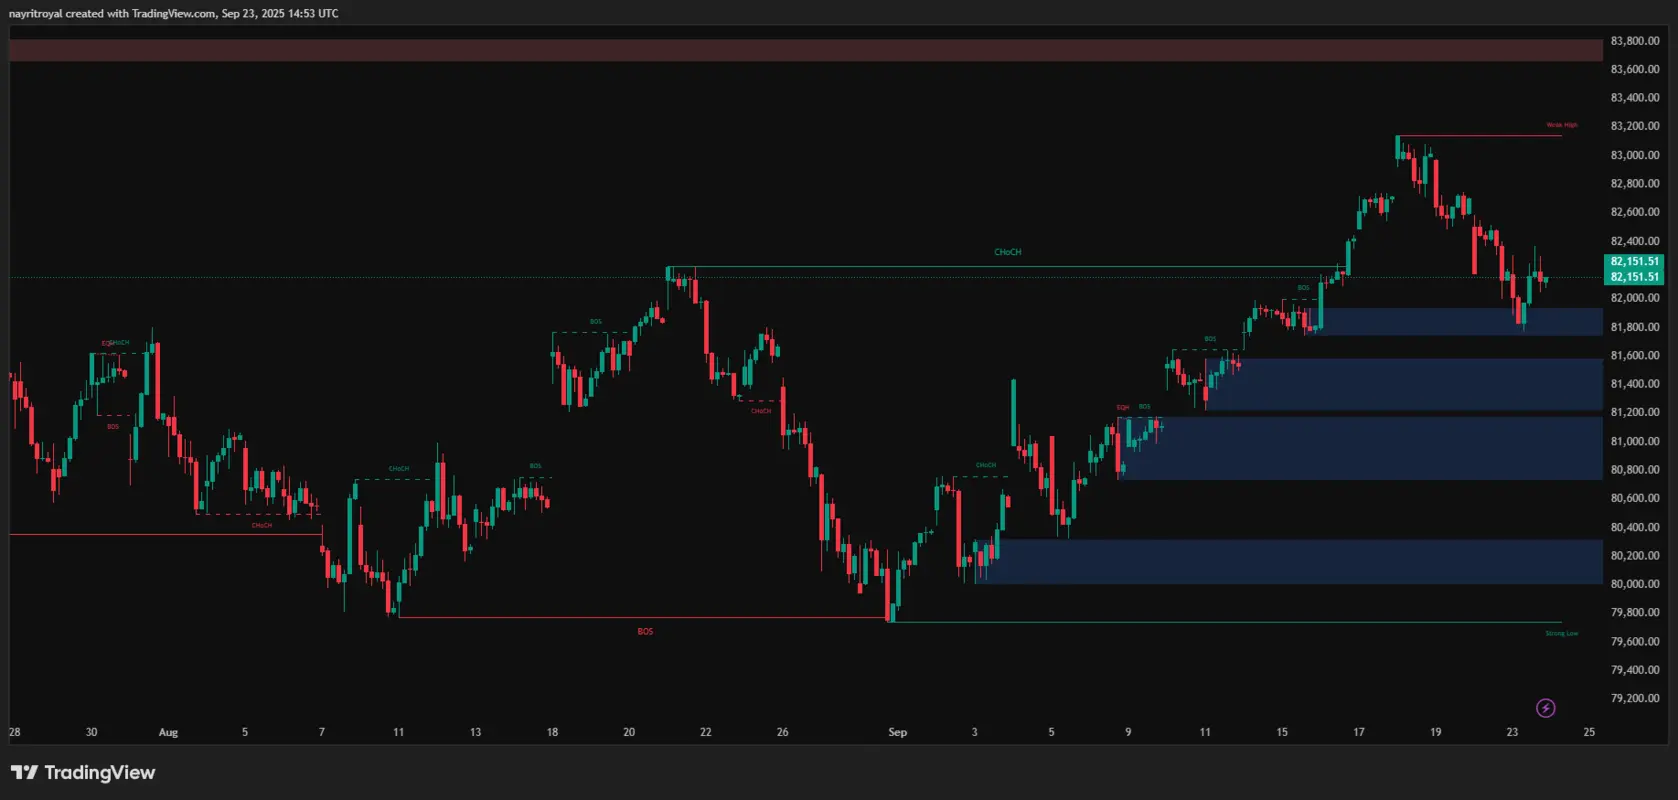
Sensex 1hr chart
Sensex Critical Level Analysis:
Support Infrastructure:
- Primary Support: 82,000 (Major psychological level with institutional backing)
- Secondary Support: 81,750 (Previous consolidation zone)
- Extended Support: 81,500 (Weekly chart support and FII accumulation zone)
Resistance Framework:
- Immediate Resistance: 82,500 (Short-term supply zone)
- Major Resistance: 82,800-83,000 (Previous swing high cluster)
- Extended Resistance: 83,200-83,500 (Monthly resistance and profit booking zone)
Advanced Options Chain Analysis and Market Sentiment
Comprehensive Options Chain Analysis Insights
Our detailed examination of the options chain reveals several critical insights for market prediction:
Nifty Options Data:
- Put-Call Ratio: 0.86 (Mildly bearish but within normal range)
- Maximum Put OI: 25,000 strike (41 points premium indicating strong support)
- Maximum Call OI: 25,200 strike (Immediate resistance zone)
- Put Writing: Concentrated at 24,800-25,000 strikes
- Call Writing: Visible at 25,200-25,400 strikes
Bank Nifty Options Landscape:
- Put-Call Ratio: 0.92 (Near neutral with slight put bias)
- Max Put OI: 55,000 strike (Strong psychological support)
- Max Call OI: 56,000 strike (Major resistance confirmation)
- Volatility: Elevated at 18-20% indicating potential large moves
Participant-wise Data Analysis
Retail Trader Positioning:
- Strategy: Predominantly call writing + put writing (range-bound expectation)
- Net Position: Slightly positive but reduced from previous day
- Implication: Expecting sideways to mildly bullish movement
FII (Foreign Institutional Investors) Activity:
- Equity: Net selling of ₹3,500 crores (significant outflow)
- Futures: 1,000 contracts long addition, 1,072 contracts short covering
- Options: More put long unwinding than call short covering
- Net Impact: Gradually turning less bearish in derivatives trading
DII (Domestic Institutional Investors) Positioning:
- Equity: Strong buying of ₹2,671 crores (offsetting FII selling)
- Futures: 180 long contracts addition, 1,600 short contracts covering
- Trend: Consistently accumulating on dips across all segments
- Strategy: Counter-trend buying supporting market stability
Sectoral Analysis and Stock-Specific Opportunities
Banking Sector Deep Dive
The banking sector continues to show outperformance with several PSU and private sector banks leading the charge. Our technical analysis identifies multiple opportunities:
Top Banking Picks:
- IndusInd Bank: Technical breakout pattern with institutional accumulation
- Axis Bank: Strong delivery-based buying with improving fundamentals
- SBI: Continued institutional interest with robust derivatives trading volumes
- Bank of Baroda: Emerging from consolidation with volume support
Caution Areas:
- ICICI Bank: GST show-cause notice of ₹15.61 crores creating short-term overhang
- Federal Bank: Technical weakness with declining institutional interest
Infrastructure and Defense Themes
Key Sector Highlights:
- HAL (Hindustan Aeronautics): Potential ₹4,000 crore order for advanced CAT system technology
- BEL (Bharat Electronics): Beneficiary of defense modernization with recent Nifty 50 inclusion
- KNR Construction: ₹459 crore order received, trading at 50% discount to 2024 highs
Investment Strategy: Focus on companies with strong order books and government backing in the current infrastructure push.
The Indian stock market trends from 1989 to 2022 showing the number of issues and amount raised, highlighting recent growth.
Tomorrow's Comprehensive Trading Plan
Pre-Market Analysis and Setup
Global Market Cues:
- US Markets: Dow Jones up 300 points (positive sentiment)
- Asian Markets: Mixed performance with technology stocks under pressure
- Currency: INR showing stability against USD
- Commodities: Crude oil prices steady, gold showing consolidation
Gift Nifty Analysis:
- Current Level: 25,247 (vs Nifty close of 25,255)
- Gap: Minimal gap of -8 points (essentially flat opening)
- Implication: Market likely to continue yesterday's consolidation
Advanced Derivatives Trading Strategies
For Professional Traders:
Strategy 1: Iron Condor (Range-bound expectation)
- Sell: 24,900 Put + 25,300 Call
- Buy: 24,800 Put + 25,400 Call
- Premium: ₹35-40 per lot
- Max Profit: Premium collected if Nifty stays between 24,900-25,300
- Risk: Unlimited beyond breakeven points
Strategy 2: Long Straddle (Volatility play)
- Buy: 25,000 Put + 25,000 Call (ATM)
- Premium: ₹85-90 per lot
- Breakeven: 24,910 and 25,090
- Logic: Expecting significant movement in either direction
Strategy 3: Butterfly Spread (Limited risk/reward)
- Structure: Buy 24,900 Put, Sell 2x 25,000 Put, Buy 25,100 Put
- Net Premium: ₹15-20 debit
- Max Profit: ₹85 if Nifty closes at 25,000
- Max Loss: Premium paid
Risk Management Framework
Position Sizing Guidelines:
- Maximum Risk: 2% of total capital per trade
- Stop Loss: Mandatory on all positions (no averaging down)
- Profit Booking: Scale out at predetermined levels
- Time Decay: Close all options positions 1 hour before expiry
Money Management Rules:
- Win Rate Target: 60% (Focus on risk-reward ratio)
- Risk-Reward: Minimum 1:2 for all swing trades
- Maximum Positions: 3-4 concurrent trades across different timeframes
- Review Period: Daily analysis and weekly strategy adjustment
Market Outlook and Strategic Recommendations
Short-term Outlook (1-5 Trading Days)
The Indian stock market is positioned for a potential directional move from current consolidation levels. Our comprehensive technical analysis and options chain analysis suggest that the completion of healthy retracement across major indices provides a strong foundation for the next leg of movement. The mixed FII-DII data indicates a transition period where domestic flows are gradually taking precedence over foreign investor sentiment.
Probability Matrix:
- Bullish Breakout: 45% (Above key resistance levels)
- Bearish Breakdown: 25% (Below major support zones)
- Continued Consolidation: 30% (Range-bound trading)
Medium-term Perspective (2-4 Weeks)
Fundamental Factors Supporting Markets:
- Strong domestic institutional flows offsetting foreign selling
- Robust corporate earnings growth expectations
- Government infrastructure spending continuing
- Derivatives trading volumes remaining elevated indicating active participation
Risk Factors to Monitor:
- Global economic uncertainty and central bank policies
- Geopolitical tensions affecting market sentiment
- Currency fluctuations impacting FII flows
- Sectoral rotation from growth to value stocks
Support and Resistance Levels - Master Summary
Nifty 50 Complete Framework:
- Major Resistance: 25,450-25,500 (Monthly highs)
- Key Resistance: 25,330-25,368 (Immediate targets)
- Pivot Resistance: 25,150-25,200 (Breakout levels)
- Current Range: 25,000-25,150 (Consolidation zone)
- Pivot Support: 24,980-25,000 (Demand zone)
- Key Support: 24,800-24,850 (Institutional buying)
- Major Support: 24,600-24,700 (Weekly chart support)
Bank Nifty Master Levels:
- Major Resistance: 56,300-56,500 (Monthly targets)
- Key Resistance: 56,000-56,151 (Immediate hurdles)
- Pivot Resistance: 55,688-55,835 (Breakout zone)
- Current Range: 55,317-55,688 (Decision zone)
- Pivot Support: 54,917-55,000 (Demand area)
- Key Support: 54,600-54,800 (Strong institutional backing)
- Major Support: 54,300-54,500 (Weekly chart foundation)

The National Stock Exchange (NSE) building in India, home of the Nifty 50 index and a central hub for Indian stock market activities.
Advanced Trading Recommendations and Final Thoughts
Professional Trading Setups
High-Probability Setup 1: Nifty Breakout Trade
- Entry: 15-minute closing above 25,261
- Target Sequence: 25,317 → 25,368 → 25,450
- Stop Loss: 25,184 (Previous day close)
- Position Size: 3% of trading capital
- Time Horizon: 1-3 trading sessions
High-Probability Setup 2: Bank Nifty Momentum Trade
- Entry: Above 55,688 with volume confirmation
- Target Ladder: 55,835 → 56,000 → 56,151
- Risk Management: 55,474 stop loss
- Position Size: 2.5% of trading capital
- Duration: Intraday to 2-day swing
Conservative Setup: Range Trading Strategy
- Buy Zone: 24,980-25,000 (Nifty), 55,317-55,400 (Bank Nifty)
- Sell Zone: 25,130-25,150 (Nifty), 55,650-55,688 (Bank Nifty)
- Position Size: 1.5% per trade
- Success Rate: Historical 70%+ in similar market conditions
Key Takeaways for Market Participants
For Day Traders:
- Focus on the first hour and last hour for maximum volatility
- Use options chain analysis to identify key levels for the day
- Maintain strict stop losses and avoid overnight positions in current environment
- Derivatives trading offers better risk-adjusted returns than cash market
For Swing Traders:
- Current consolidation provides excellent entry opportunities
- Support and resistance levels are well-defined for risk management
- 3-5 day holding period optimal for current market cycle
- Focus on sector rotation themes for alpha generation
For Long-term Investors:
- Use current correction for systematic accumulation
- Focus on quality stocks with strong fundamentals
- Banking and infrastructure themes remain attractive
- Avoid over-leverage in current volatile environment
Market Prediction Summary
Our comprehensive analysis for September 24, 2025, indicates that the Indian stock market is at a crucial inflection point. The technical analysis framework suggests that while immediate direction remains uncertain, the medium-term structure remains constructive. Options chain analysis provides clear levels for both bulls and bears, while derivatives trading activity continues to support overall market liquidity.
The successful defense of key support levels by institutional buying provides confidence, while the measured approach by smart money suggests accumulation rather than distribution. Market analysis for tomorrow points toward continued consolidation with a gradual bias toward higher levels, contingent on global developments and domestic institutional flows.
Traders and investors should remain nimble, focus on high-probability setups around defined support and resistance levels, and maintain strict risk management protocols. The current market environment rewards patience, discipline, and systematic approach rather than aggressive speculation.
Final Market Outlook: Cautiously optimistic with defined risk parameters and multiple opportunities for different trading styles and time horizons.
Important Disclaimer: This technical analysis is for educational and informational purposes only. It should not be construed as personalized investment advice. Derivatives trading involves substantial risk and may not be suitable for all investors. Past performance is not indicative of future results. Always consult with qualified financial advisors and conduct thorough research before making investment decisions. The volatile nature of options chain analysis and market prediction requires careful consideration of individual risk tolerance and investment objectives.