Trading Chart Patterns in Technical Analysis: A Complete Guide for Traders | Option Matrix India (OMI)
Introduction
In the world of trading, Trading Chart Patterns are powerful tools that help traders predict future price movements based on historical data. Whether you're trading stocks, options, commodities, or forex, understanding chart patterns can significantly enhance your decision-making. At Option Matrix India (OMI), we aim to equip our users with the most practical tools and knowledge, and chart pattern analysis is one of the most effective strategies in technical analysis.
What Are Chart Patterns?
Chart patterns are visual representations formed by the price movements of an asset over time. They are a fundamental aspect of technical analysis, used to identify potential continuation or reversal signals in the market.
These patterns emerge due to market psychology—human emotions like fear, greed, and indecision—which tend to repeat over time, forming recognizable formations on the price chart.
Types of Chart Patterns
Chart patterns can be broadly categorized into three types:
1. Reversal Patterns
These patterns indicate that an existing trend is about to reverse.
-
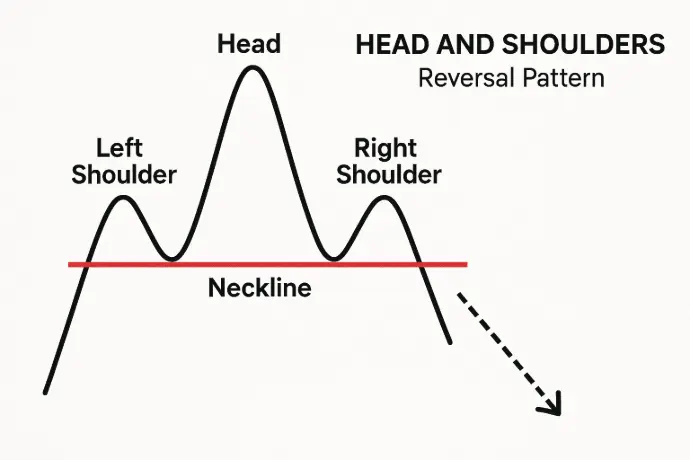
Head and Shoulders
- Formation: Three peaks—middle one being the highest.
- Implication: Reversal of an uptrend.
-
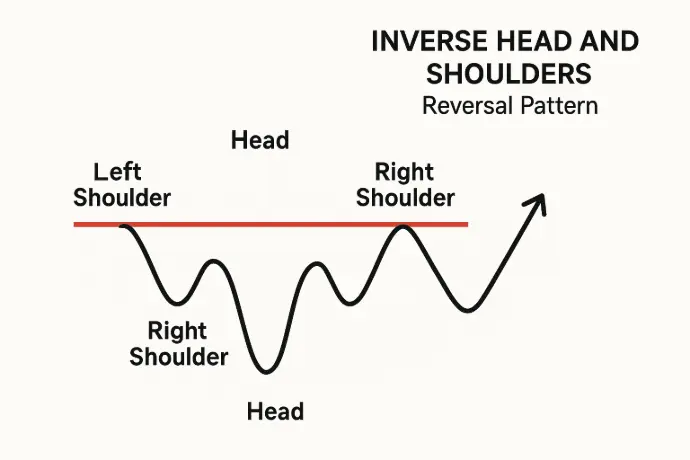
Inverse Head and Shoulders
- Signals a reversal from downtrend to uptrend.
-
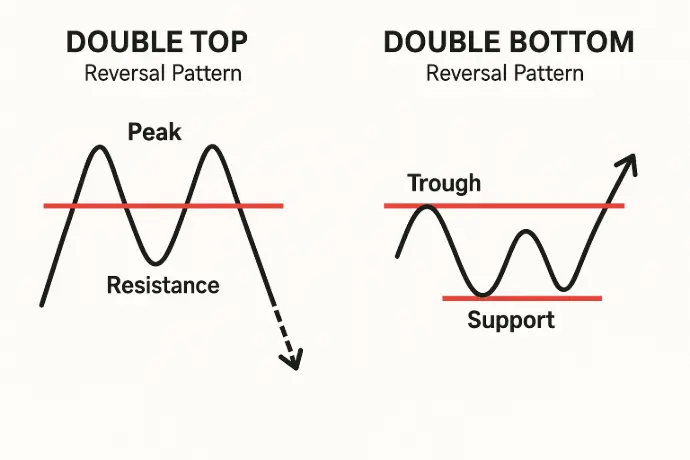
Double Top and Double Bottom
- Two consecutive peaks (or troughs) at nearly the same price level.
- Common in both bullish and bearish reversals.
2. Continuation Patterns
These suggest that the current trend will likely continue after a temporary consolidation.
-
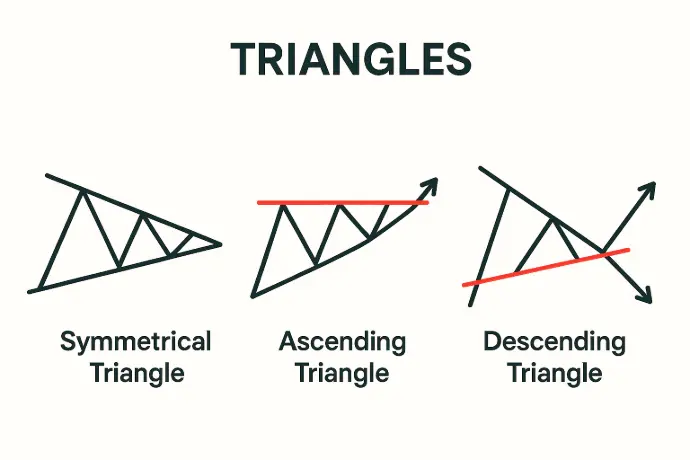
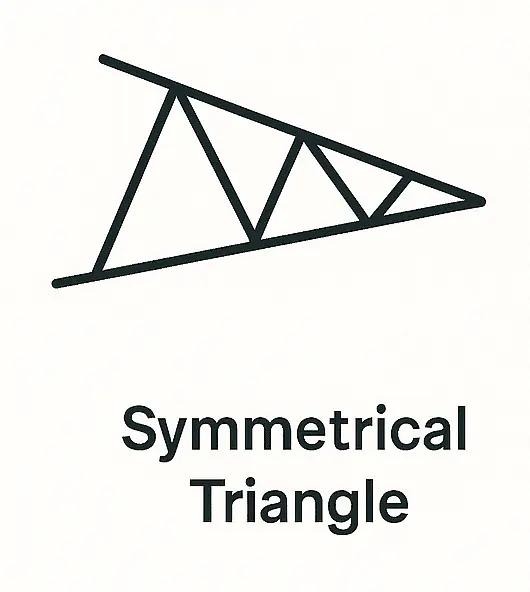
Triangles (Symmetrical, Ascending, Descending)
- Show a narrowing price range before a breakout.
-
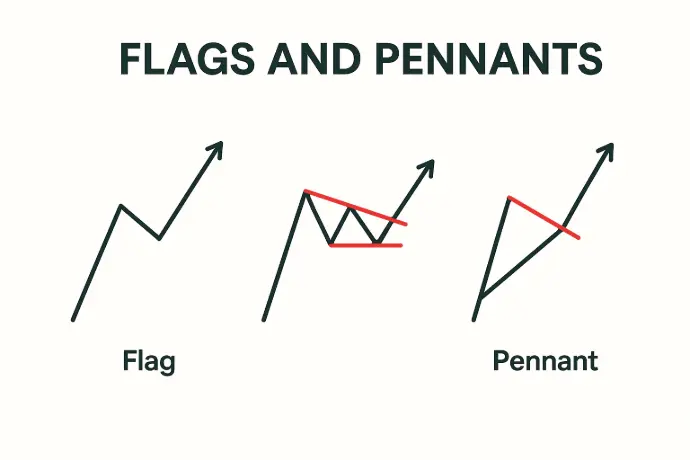
Flags and Pennants
- Small, short-term patterns that show brief consolidation before trend continuation.
-
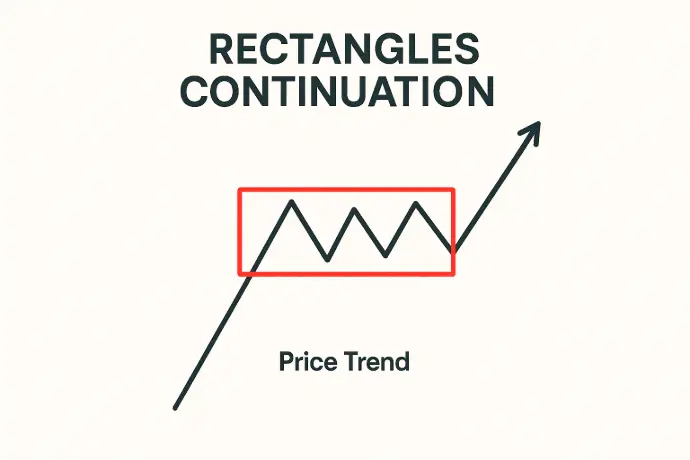
Rectangles
- Horizontal trading ranges indicating accumulation or distribution.
3. Bilateral Patterns
These patterns can lead to either continuation or reversal depending on breakout direction.
-
Symmetrical Triangle
- Wait for a breakout confirmation.
-
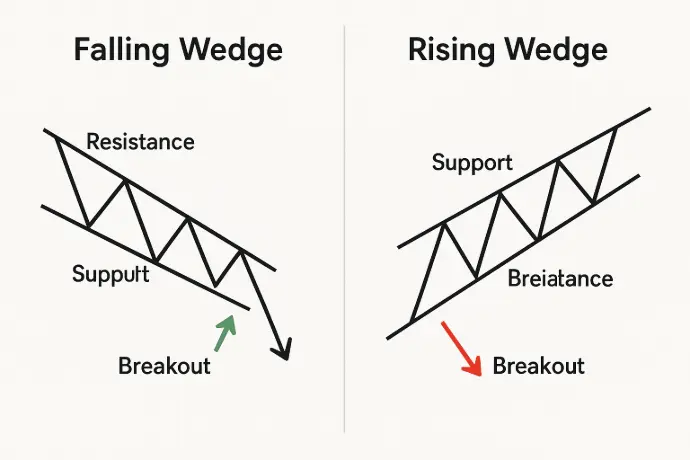
Wedges (Falling and Rising)
- Can act as reversal or continuation patterns depending on the trend.
How to Use Chart Patterns in Trading
Step 1: Identify the Pattern
Use candlestick charts (preferably daily or hourly) to scan for familiar patterns.
Step 2: Confirm the Pattern
Use indicators like Volume, Relative Strength Index (RSI), or Moving Averages to confirm the validity of the pattern.
Step 3: Set Entry and Exit Points
- Entry: After confirmation (usually at breakout).
- Stop Loss: Just outside the opposite side of the pattern.
- Target Price: Based on the pattern’s height or depth.
Step 4: Combine with Other Tools
Chart patterns are best used in conjunction with:
- Trendlines
- Fibonacci retracements
- Support and Resistance zones
Why Chart Patterns Matter in Options Trading
In options trading, timing and direction are critical. Chart patterns can help you:
- Predict price breakouts for directional options plays.
- Anticipate consolidation for straddle/strangle strategies.
- Confirm volatility changes for planning spreads.
Final Thoughts
Mastering chart patterns is a vital step in becoming a successful trader. At Option Matrix India (OMI), we encourage traders to combine pattern recognition with disciplined risk management for consistent results.
👉 Stay tuned for our live webinars, trading courses, and pattern recognition tools launching soon!
