Mastering Candle stick Patterns in Technical Analysis
Candlestick charts are a cornerstone of technical analysis, offering visual insights into market sentiment and potential price movements. Each candlestick encapsulates four key data points: open, high, low, and close prices within a specific time frame. Recognizing and interpreting various candlestick patterns can significantly enhance trading decisions.
Understanding Candlestick Components
Body: Represents the range between the opening and closing prices. A filled (often red or black) body indicates a closing price lower than the opening, while a hollow (often green or white) body indicates a closing price higher than the opening.
Wicks (Shadows): The lines extending above and below the body, representing the highest and lowest prices during the time frame.
Common Candlestick Patterns (Top 10 Patterns)
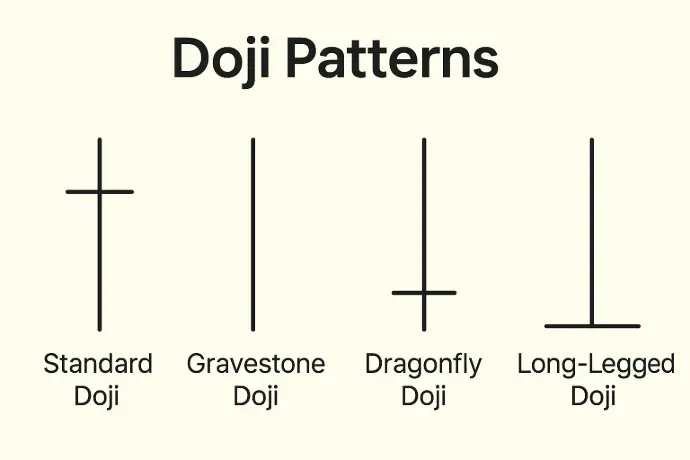
1. Doji
Description: The opening and closing prices are virtually equal, resulting in a very short body.
Significance: Indicates market indecision; potential reversal signal.
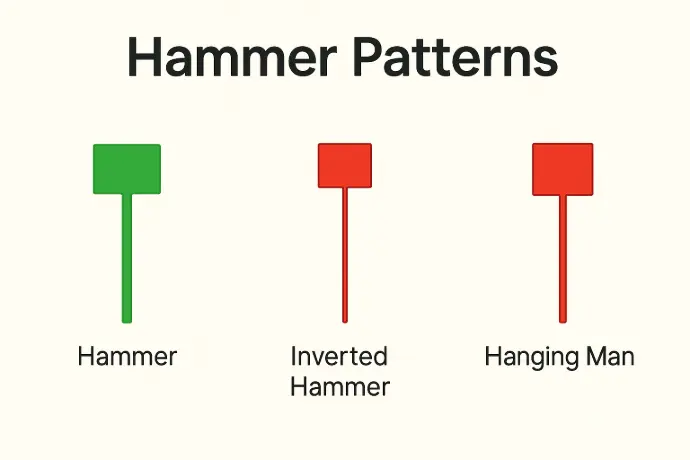
2. Hammer
Description: A small body at the top with a long lower wick.
Significance: Suggests a potential bullish reversal after a downtrend.
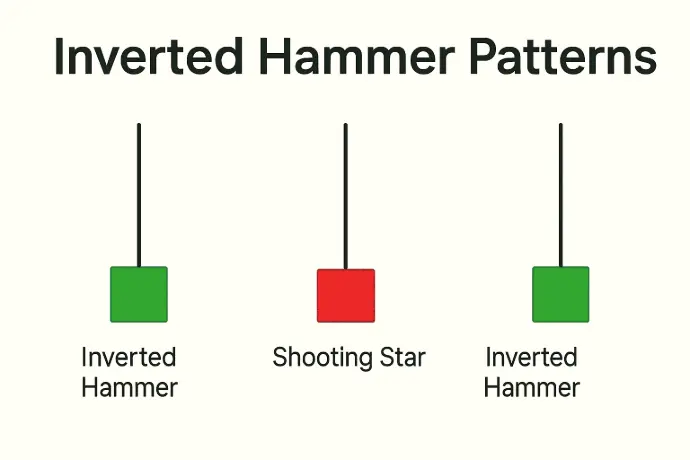
3. Inverted Hammer
Description: A small body at the bottom with a long upper wick.
Significance: May indicate a bullish reversal after a downtrend.
4. Shooting Star
Description: A small body at the bottom with a long upper wick.
Significance: Signals a potential bearish reversal after an uptrend.
5. Bullish Engulfing
Description: A small bearish candle followed by a larger bullish candle that completely engulfs the previous one.
Significance: Indicates strong buying pressure; potential bullish reversal.
6. Bearish Engulfing
Description: A small bullish candle followed by a larger bearish candle that completely engulfs the previous one.
Significance: Indicates strong selling pressure; potential bearish reversal.
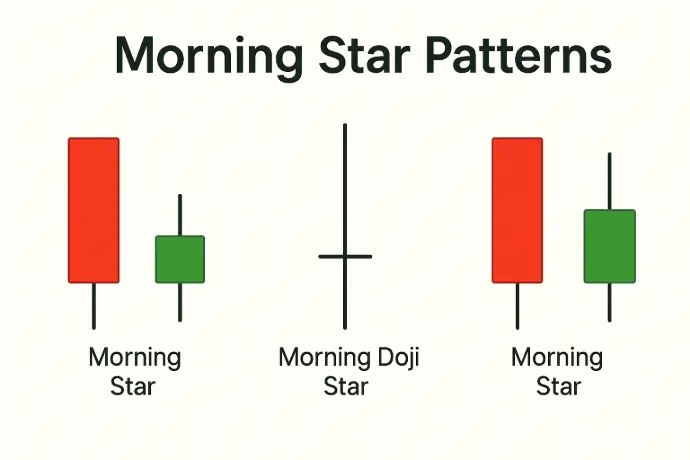
7. Morning Star
Description: A three-candle pattern: a long bearish candle, a short-bodied candle (Doji or Spinning Top), and a long bullish candle.
Significance: Signals a potential bullish reversal.
8. Evening Star
Description: A three-candle pattern: a long bullish candle, a short-bodied candle, and a long bearish candle.
Significance: Signals a potential bearish reversal.
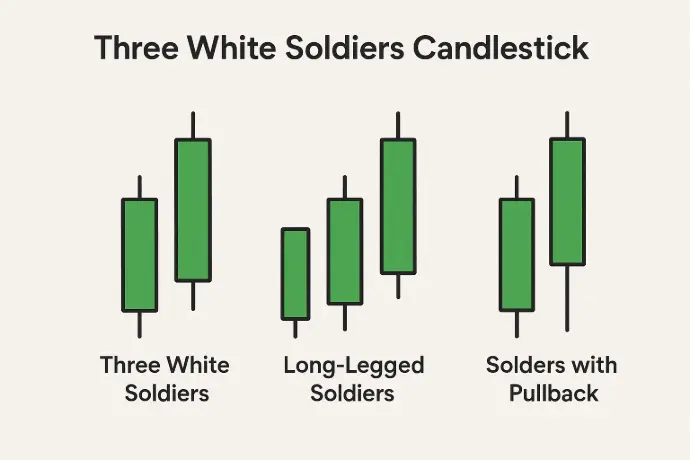
9. Three White Soldiers
Description: Three consecutive long bullish candles with higher closes.
Significance: Strong bullish signal indicating continued upward momentum.
10. Three Black Crows
Description: Three consecutive long bearish candles with lower closes.
Significance: Strong bearish signal indicating continued downward momentum.
Application in Indian Markets
Understanding these candlestick patterns can be particularly beneficial when trading in Indian markets such as Nifty and Bank Nifty. For instance:
- A Bullish Engulfing pattern on the Nifty 50 chart may suggest a potential upward movement, signaling a buying opportunity.
- A Shooting Star pattern on the Bank Nifty chart could indicate a potential downward reversal, suggesting a selling opportunity.
By mastering these candlestick patterns, traders can make more informed decisions and better anticipate market movements.
तकनीकी विश्लेषण में कैंडलस्टिक पैटर्न में महारत हासिल करना
कैंडलस्टिक चार्ट तकनीकी विश्लेषण का एक आधार हैं, जो बाजार की भावना और संभावित मूल्य आंदोलनों के बारे में दृश्य जानकारी प्रदान करते हैं। प्रत्येक कैंडलस्टिक एक विशिष्ट समय सीमा के भीतर चार प्रमुख डेटा बिंदुओं को समाहित करता है: खुला, उच्च, निम्न और बंद कीमतें। विभिन्न कैंडलस्टिक पैटर्न को पहचानना और उनकी व्याख्या करना ट्रेडिंग निर्णयों को काफी बढ़ा सकता है।
कैंडलस्टिक घटकों को समझना
बॉडी: खुलने और बंद होने की कीमतों के बीच की सीमा को दर्शाता है। एक भरा हुआ (आमतौर पर लाल या काला) बॉडी खुलने की कीमत से कम बंद कीमत को इंगित करता है, जबकि एक खोखला (आमतौर पर हरा या सफेद) बॉडी खुलने की कीमत से अधिक बंद कीमत को इंगित करता है।
विक्स (छाया): बॉडी के ऊपर और नीचे तक फैली हुई रेखाएं, जो समय सीमा के दौरान उच्चतम और निम्नतम कीमतों को दर्शाती हैं।
सामान्य कैंडलस्टिक पैटर्न (शीर्ष 10 पैटर्न)
1. डोजी
विवरण: खुलने और बंद होने की कीमतें लगभग समान होती हैं, जिसके परिणामस्वरूप बॉडी बहुत छोटी होती है।
महत्व: बाजार की अनिर्णय को इंगित करता है; संभावित उलट संकेत।
2. हैमर
विवरण: शीर्ष पर एक छोटा बॉडी और लंबा निचला विक्स।
महत्व: डाउनट्रेंड के बाद संभावित बुलिश उलट का सुझाव देता है।
3. इनवर्टेड हैमर
विवरण: नीचे एक छोटा बॉडी और लंबा ऊपरी विक्स।
महत्व: डाउनट्रेंड के बाद बुलिश उलट का संकेत दे सकता है।
4. शूटिंग स्टार
विवरण: नीचे एक छोटा बॉडी और लंबा ऊपरी विक्स।
महत्व: अपट्रेंड के बाद संभावित बेयरिश उलट का संकेत देता है।
5. बुलिश एनगल्फिंग
विवरण: एक छोटी बेयरिश कैंडल के बाद एक बड़ी बुलिश कैंडल जो पिछले को पूरी तरह से ढक लेती है।
महत्व: मजबूत खरीद दबाव को इंगित करता है; संभावित बुलिश उलट।
6. बेयरिश एनগल्फिंग
विवरण: एक छोटी बुलिश कैंडल के बाद एक बड़ी बेयरिश कैंडल जो पिछले को পूरी तरह से ढक लेती है।
महत्व: मजबूत बिक्री दबाव को इंगित करता है; संभावित बेयरिश उलट।
7. मॉर्निंग स्टार
विवरण: एक तीन-कैंडल पैटर्न: एक लंबी बेयरिश कैंडल, एक छोटी बॉडी वाली कैंडल (डोजी या स्पिनिंग टॉप), और एक लंबी बुलिश कैंडल।
महत्व: संभावित बुलिश उलट का संकेत देता है।
8. इवनिंग स्टार
विवरण: एक तीन-कैंडल पैटर्न: एक लंबी बुलिश कैंडल, एक छोटी बॉडी वाली कैंडल, और एक लंबी बेयरिश कैंडल।
महत्व: संभावित बेयरिश उलट का संकेत देता है।
9. थ्री व्हाइट सोल्जर्स
विवरण: उच्च बंद के साथ तीन लगातार लंबी बुलिश कैंडल्स।
महत्व: मजबूत बुलिश संकेत जो ऊपर की गति को जारी रखने का संकेत देता है।
10. थ्री ब्लैक क्रोज
विवरण: निचले बंद के साथ तीन लगातार लंबी बेयरिश कैंडल्स।
महत्व: मजबूत बेयरिश संकेत जो नीचे की गति को जारी रखने का संकेत देता है।
भारतीय बाजारों में अनुप्रयोग
इन कैंडलस्टिक पैटर्न को समझना निफ्टी और बैंक निफ्टी जैसे भारतीय बाजारों में ट्रेडिंग करते समय विशेष रूप से फायदेमंद हो सकता है। उदाहरण के लिए:
- निफ्टी 50 चार्ट पर बुलिश एनगल्फिंग पैटर्न एक संभावित ऊपर की ओर आंदोलन का सुझाव दे सकता है, जो खरीद के अवसर का संकेत देता है।
- बैंक निफ्टी चार्ट पर शूटिंग स्टार पैटर्न एक संभावित नीचे की ओर उलट का संकेत दे सकता है, जो बेचने के अवसर का सुझाव देता है।
इन कैंडलस्टिक पैटर्न में महारत हासिल करके, व्यापारी अधिक सूचित निर्णय ले सकते हैं और बाजार आंदोलनों का बेहतर अनुमान लगा सकते हैं।
টেকনিক্যাল অ্যানালাইসিসে ক্যান্ডলস্টিক প্যাটার্ন আয়ত্ত করা
ক্যান্ডলস্টিক চার্ট টেকনিক্যাল অ্যানালাইসিস এর একটি ভিত্তি, যা বাজার সেন্টিমেন্ট এবং সম্ভাব্য মূল্য আন্দোলন সম্পর্কে ভিজ্যুয়াল তথ্য প্রদান করে। প্রতিটি ক্যান্ডলস্টিক একটি নির্দিষ্ট সময় ফ্রেমের মধ্যে চারটি মূল তথ্য বিন্দু ধারণ করে: ওপেন, হাই, লো এবং ক্লোজ প্রাইস। বিভিন্ন ক্যান্ডলস্টিক প্যাটার্ন চিনতে এবং ব্যাখ্যা করতে পারলে ট্রেডিং সিদ্ধান্ত উল্লেখযোগ্যভাবে উন্নত হতে পারে।
ক্যান্ডলস্টিক উপাদান বুঝতে
বডি: ওপেন এবং ক্লোজ প্রাইসের মধ্যে পরিসর প্রতিনিধিত্ব করে। একটি ভরা (সাধারণত লাল বা কালো) বডি ওপেন প্রাইসের চেয়ে কম ক্লোজ প্রাইস নির্দেশ করে, যখন একটি ফাঁপা (সাধারণত সবুজ বা সাদা) বডি ওপেন প্রাইসের চেয়ে বেশি ক্লোজ প্রাইস নির্দেশ করে।
উইকস (শ্যাডো): বডির উপরে এবং নীচে প্রসারিত রেখাগুলি, যা সময় ফ্রেমের মধ্যে সর্বোচ্চ এবং সর্বনিম্ন মূল্যগুলি প্রতিনিধিত্ব করে।
সাধারণ ক্যান্ডলস্টিক প্যাটার্ন (শীর্ষ 10 প্যাটার্ন)
1. ডোজি
বিবরণ: ওপেন এবং ক্লোজ প্রাইস প্রায় সমান, যার ফলে একটি খুব ছোট বডি হয়।
গুরুত্ব: বাজার অনিশ্চয়তা নির্দেশ করে; সম্ভাব্য রিভার্সাল সিগন্যাল।
2. হ্যামার
বিবরণ: শীর্ষে একটি ছোট বডি এবং একটি দীর্ঘ নিম্ন উইক।
গুরুত্ব: ডাউনট্রেন্ডের পরে সম্ভাব্য বুলিশ রিভার্সাল সুপারিশ করে।
3. ইনভার্টেড হ্যামার
বিবরণ: নীচে একটি ছোট বডি এবং একটি দীর্ঘ উপরের উইক।
গুরুত্ব: ডাউনট্রেন্ডের পরে বুলিশ রিভার্সাল নির্দেশ করতে পারে।
4. শুটিং স্টার
বিবরণ: নীচে একটি ছোট বডি এবং একটি দীর্ঘ উপরের উইক।
গুরুত্ব: আপট্রেন্ডের পরে সম্ভাব্য বেয়ারিশ রিভার্সাল সিগন্যাল দেয়।
5. বুলিশ এনগলফিং
বিবরণ: একটি ছোট বেয়ারিশ ক্যান্ডল এর পরে একটি বড় বুলিশ ক্যান্ডল যা আগেরটিকে সম্পূর্ণরূপে গ্রাস করে।
গুরুত্ব: শক্তিশালী ক্রয় চাপ নির্দেশ করে; সম্ভাব্য বুলিশ রিভার্সাল।
6. বেয়ারিশ এনগলফিং
বিবরণ: একটি ছোট বুলিশ ক্যান্ডল এর পরে একটি বড় বেয়ারিশ ক্যান্ডল যা আগেরটিকে সম্পূর্ণরূপে গ্রাস করে।
গুরুত্ব: শক্তিশালী বিক্রয় চাপ নির্দেশ করে; সম্ভাব্য বেয়ারিশ রিভার্সাল।
7. মর্নিং স্টার
বিবরণ: একটি তিন-ক্যান্ডল প্যাটার্ন: একটি দীর্ঘ বেয়ারিশ ক্যান্ডল, একটি ছোট বডি ক্যান্ডল (ডোজি বা স্পিনিং টপ), এবং একটি দীর্ঘ বুলিশ ক্যান্ডল।
গুরুত্ব: সম্ভাব্য বুলিশ রিভার্সাল সিগন্যাল দেয়।
8. ইভনিং স্টার
বিবরণ: একটি তিন-ক্যান্ডল প্যাটার্ন: একটি দীর্ঘ বুলিশ ক্যান্ডল, একটি ছোট বডি ক্যান্ডল, এবং একটি দীর্ঘ বেয়ারিশ ক্যান্ডল।
গুরুত্ব: সম্ভাব্য বেয়ারিশ রিভার্সাল সিগন্যাল দেয়।
9. থ্রি হোয়াইট সোলজার্স
বিবরণ: উচ্চতর ক্লোজ সহ তিনটি ধারাবাহিক দীর্ঘ বুলিশ ক্যান্ডল।
গুরুত্ব: শক্তিশালী বুলিশ সিগন্যাল যা ঊর্ধ্বমুখী গতি অব্যাহত থাকার ইঙ্গিত দেয়।
10. থ্রি ব্ল্যাক ক্রোজ
বিবরণ: নিম্নতর ক্লোজ সহ তিনটি ধারাবাহিক দীর্ঘ বেয়ারিশ ক্যান্ডল।
গুরুত্ব: শক্তিশালী বেয়ারিশ সিগন্যাল যা নিম্নমুখী গতি অব্যাহত থাকার ইঙ্গিত দেয়।
ভারতীয় বাজার এ প্রয়োগ
এই ক্যান্ডলস্টিক প্যাটার্ন গুলি বোঝা নিফটি এবং ব্যাঙ্ক নিফটি এর মতো ভারতীয় বাজারে ট্রেডিং করার সময় বিশেষভাবে উপকারী হতে পারে। উদাহরণ স্বরূপ:
- নিফটি 50 চার্টে বুলিশ এনগলফিং প্যাটার্ন একটি সম্ভাব্য ঊর্ধ্বমুখী আন্দোলনের ইঙ্গিত দিতে পারে, যা একটি ক্রয়ের সুযোগের সংকেত দেয়।
- ব্যাঙ্ক নিফটি চার্টে শুটিং স্টার প্যাটার্ন একটি সম্ভাব্য নিম্নমুখী রিভার্সাল নির্দেশ করতে পারে, যা একটি বিক্রয়ের সুযোগের ইঙ্গিত দেয়।
এই ক্যান্ডলস্টিক প্যাটার্ন গুলি আয়ত্ত করে, ট্রেডাররা আরও তথ্যপূর্ণ সিদ্ধান্ত নিতে পারে এবং বাজার আন্দোলন আরও ভালভাবে অনুমান করতে পারে।
টেকনিকেল এনালাইচিছত কেণ্ডলষ্টিক পেটাৰ্ণ আয়ত্ত কৰা
কেণ্ডলষ্টিক চাৰ্ট টেকনিকেল এনালাইচিছ ৰ এক ভেটি, যিয়ে বজাৰৰ অনুভূতি আৰু সম্ভাব্য মূল্যৰ চলাচল সম্পৰ্কে দৃশ্যমান তথ্য প্ৰদান কৰে। প্ৰতিটো কেণ্ডলষ্টিকে এটা নিৰ্দিষ্ট সময়ৰ ভিতৰত চাৰিটা মূল তথ্য বিন্দু সামৰি লয়: খোলা, উচ্চ, নিম্ন আৰু বন্ধ মূল্য। বিভিন্ন কেণ্ডলষ্টিক পেটাৰ্ণ চিনাক্ত কৰা আৰু ব্যাখ্যা কৰাটোৱে ট্ৰেডিং সিদ্ধান্তক যথেষ্ট পৰিমাণে উন্নত কৰিব পাৰে।
কেণ্ডলষ্টিক ৰ উপাদানসমূহ বুজিবলৈ
শৰীৰ: খোলা আৰু বন্ধ মূল্যৰ মাজৰ পৰিসৰক প্ৰতিনিধিত্ব কৰে। এটা ভৰা (সাধাৰণতে ৰঙা বা ক'লা) শৰীৰে খোলা মূল্যতকৈ কম বন্ধ মূল্য সূচায়, আনহাতে এটা খালী (সাধাৰণতে সেউজীয়া বা বগা) শৰীৰে খোলা মূল্যতকৈ বেছি বন্ধ মূল্য সূচায়।
উইকছ (ছায়া): শৰীৰৰ ওপৰ আৰু তললৈ বিস্তাৰিত ৰেখাবোৰ, যিয়ে সময়ৰ ভিতৰত সৰ্বোচ্চ আৰু সৰ্বনিম্ন মূল্যবোৰক প্ৰতিনিধিত্ব কৰে।
সাধাৰণ কেণ্ডলষ্টিক পেটাৰ্ণ (শীৰ্ষ 10 পেটাৰ্ণ)
1. ডজি
বৰ্ণনা: খোলা আৰু বন্ধ মূল্য প্ৰায় সমান, ফলত এটা অতি চুটি শৰীৰ হয়।
গুৰুত্ব: বজাৰৰ অনিশ্চয়তা সূচায়; সম্ভাব্য বিপৰীত সংকেত।
2. হেমাৰ
বৰ্ণনা: ওপৰত এটা সৰু শৰীৰ আৰু এটা দীঘল নিম্ন উইক।
গুৰুত্ব: এটা ডাউনট্ৰেণ্ডৰ পিছত সম্ভাব্য বুলিছ বিপৰীত সূচায়।
3. ইনভাৰ্টেড হেমাৰ
বৰ্ণনা: তলত এটা সৰু শৰীৰ আৰু এটা দীঘল ওপৰৰ উইক।
গুৰুত্ব: এটা ডাউনট্ৰেণ্ডৰ পিছত বুলিছ বিপৰীত সূচাব পাৰে।
4. শুটিং ষ্টাৰ
বৰ্ণনা: তলত এটা সৰু শৰীৰ আৰু এটা দীঘল ওপৰৰ উইক।
গুৰুত্ব: এটা আপট্ৰেণ্ডৰ পিছত সম্ভাব্য বেয়াৰিছ বিপৰীত সংকেত দিয়ে।
5. বুলিছ এংগলফিং
বৰ্ণনা: এটা সৰু বেয়াৰিছ কেণ্ডলৰ পিছত এটা ডাঙৰ বুলিছ কেণ্ডল যিয়ে আগৰটো সম্পূৰ্ণৰূপে গ্ৰাস কৰে।
গুৰুত্ব: শক্তিশালী ক্ৰয় চাপ সূচায়; সম্ভাব্য বুলিছ বিপৰীত।
6. বেয়াৰিছ এংগলফিং
বৰ্ণনা: এটা সৰু বুলিছ কেণ্ডলৰ পিছত এটা ডাঙৰ বেয়াৰিছ কেণ্ডল যিয়ে আগৰটো সম্পূৰ্ণৰূপে গ্ৰাস কৰে।
গুৰুত্ব: শক্তিশালী বিক্ৰী চাপ সূচায়; সম্ভাব্য বেয়াৰিছ বিপৰীত।
7. মৰ্নিং ষ্টাৰ
বৰ্ণনা: এটা তিনিটা-কেণ্ডলৰ পেটাৰ্ণ: এটা দীঘল বেয়াৰিছ কেণ্ডল, এটা চুটি শৰীৰৰ কেণ্ডল (ডজি বা স্পিনিং টপ), আৰু এটা দীঘল বুলিছ কেণ্ডল।
গুৰুত্ব: সম্ভাব্য বুলিছ বিপৰীত সংকেত দিয়ে।
8. ইভনিং ষ্টাৰ
বৰ্ণনা: এটা তিনিটা-কেণ্ডলৰ পেটাৰ্ণ: এটা দীঘল বুলিছ কেণ্ডল, এটা চুটি শৰীৰৰ কেণ্ডল, আৰু এটা দীঘল বেয়াৰিছ কেণ্ডল।
গুৰুত্ব: সম্ভাব্য বেয়াৰিছ বিপৰীত সংকেত দিয়ে।
9. থ্ৰি হোৱাইট চ'লজাৰ্ছ
বৰ্ণনা: উচ্চতৰ বন্ধৰ সৈতে তিনিটা ক্ৰমাগত দীঘল বুলিছ কেণ্ডল।
গুৰুত্ব: শক্তিশালী বুলিছ সংকেত যিয়ে ঊৰ্ধ্বমুখী গতি অব্যাহত থকাটো সূচায়।
10. থ্ৰি ব্লেক ক্ৰ'জ
বৰ্ণনা: নিম্নতৰ বন্ধৰ সৈতে তিনিটা ক্ৰমাগত দীঘল বেয়াৰিছ কেণ্ডল।
গুৰুত্ব: শক্তিশালী বেয়াৰিছ সংকেত যিয়ে নিম্নমুখী গতি অব্যাহত থকাটো সূচায়।
ভাৰতীয় বজাৰত প্ৰয়োগ
এই কেণ্ডলষ্টিক পেটাৰ্ণবোৰ বুজিবলৈ নিফ্টি আৰু বেংক নিফ্টিৰ দৰে ভাৰতীয় বজাৰত ট্ৰেডিং কৰোঁতে বিশেষভাৱে উপকাৰী হ'ব পাৰে। উদাহৰণস্বৰূপে:
- নিফ্টি 50 চাৰ্টত বুলিছ এংগলফিং পেটাৰ্ণে এটা সম্ভাব্য ঊৰ্ধ্বমুখী চলাচলৰ ইংগিত দিব পাৰে, যিয়ে এটা ক্ৰয়ৰ সুযোগৰ সংকেত দিয়ে।
- বেংক নিফ্টি চাৰ্টত শুটিং ষ্টাৰ পেটাৰ্ণে এটা সম্ভাব্য নিম্নমুখী বিপৰীতৰ ইংগিত দিব পাৰে, যিয়ে এটা বিক্ৰীৰ সুযোগৰ সংকেত দিয়ে।
এই কেণ্ডলষ্টিক পেটাৰ্ণবোৰ আয়ত্ত কৰি, ট্ৰেডাৰসকলে অধিক তথ্যপ্ৰসূত সিদ্ধান্ত ল'ব পাৰে আৰু বজাৰৰ চলাচল ভালদৰে অনুমান কৰিব পাৰে।
