
Volume Analysis Trading Guide — Complete Beginner to Advanced Course
Master Volume Analysis in Stock Trading. Learn Spot Volume, Futures Volume, Smart Money Detection, Institutional Activity, Breakout Confirmation, Volume Traps and Professional Trading Techniques with real examples.

What is Volume in Trading?
Understanding the fundamental building block of volume analysis — the total number of shares or contracts traded within a specific period.
Meaning of Trading Volume
Trading volume refers to the total number of shares, contracts, or units of a security that are bought and sold during a specific time period. It is one of the most critical metrics in technical analysis because it reveals the level of interest and participation in a particular stock, index, or derivative contract. Volume is essentially the lifeblood of the market — without volume, price movements lack conviction, and without understanding volume, traders operate blindly.
When you see a stock has traded 10 million shares in a day, that means 10 million shares were exchanged between buyers and sellers during that trading session. Each transaction involves a buyer and a seller. The buyer believes the price will go up, while the seller believes it will go down (or wants to book profit). This constant tug-of-war between buyers and sellers creates volume, and the analysis of this volume is what we call Volume Analysis.
How Volume is Generated
Volume is generated every time a trade is executed on the exchange. Here is the exact mechanism:
- A buyer places a buy order at a specific price (or market price)
- A seller places a sell order at the same or matching price
- The exchange matches these orders and executes the trade
- Each matched trade adds to the volume counter for that security
- If 500 shares are exchanged in one trade, volume increases by 500
Volume is always a two-sided metric. For every buyer, there is a seller. For every 1,000 shares bought, there are 1,000 shares sold. Volume counts total shares exchanged, not separately for buyers and sellers. Understanding this is critical for accurate volume analysis.
Volume vs Price Relationship
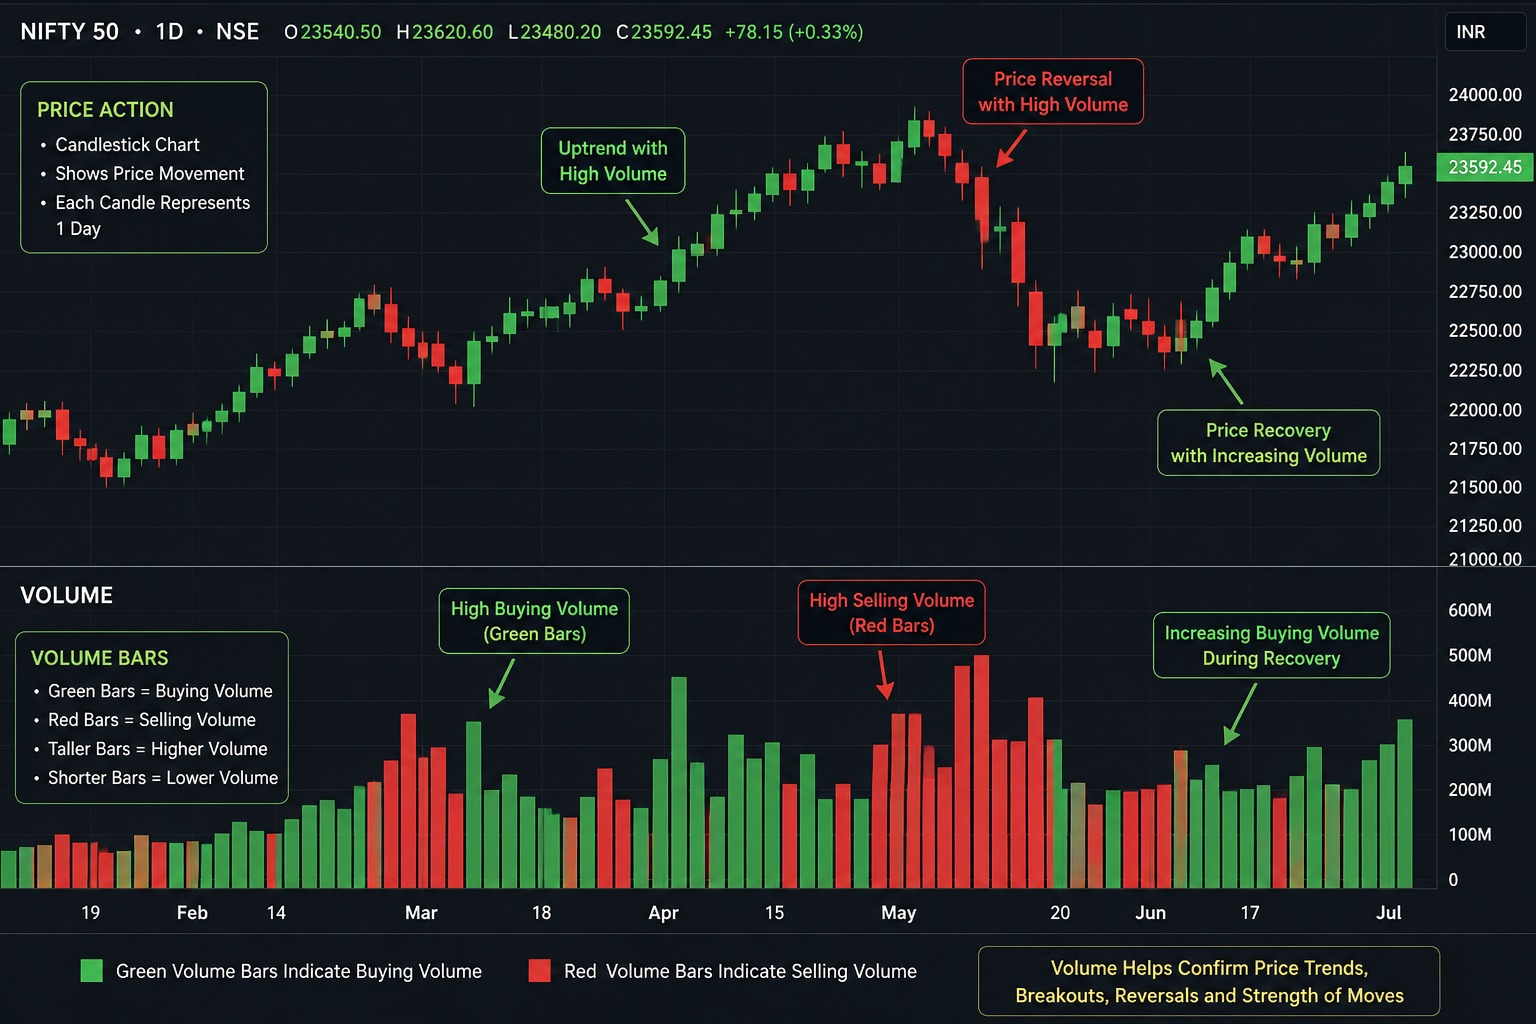
Price tells you where the market is moving. Volume tells you how strong that move is. Think of it this way: price is the car, and volume is the engine. A car can roll downhill without an engine (price can move on low volume), but for sustained uphill movement, you need a powerful engine (high volume). Professional traders always confirm price action with volume before making trading decisions.
Why Volume Matters in Trading
Volume is important because it provides crucial information that price alone cannot reveal:
- Confirmation: Volume confirms whether a price move is genuine or fake
- Strength: High volume indicates strong conviction among market participants
- Liquidity: Higher volume means easier entry and exit with minimal slippage
- Smart Money: Unusual volume often signals institutional or smart money activity
- Reversals: Extreme volume at key levels often signals potential trend reversals
- Breakouts: Volume is the primary confirmation tool for genuine breakouts
| Parameter | High Volume | Low Volume |
|---|---|---|
| Participation | Many buyers & sellers active | Few participants in market |
| Trend Reliability | High | Low |
| Breakout Validity | Genuine Breakout | Likely Fake |
| Liquidity | Easy entry & exit | Slippage risk high |
| Smart Money Signal | Possible Institutional Activity | Retail Dominated |
| Price Impact | Sustained moves | Choppy, random moves |
Why Volume is Critically Important
Volume is the single most important confirmation tool in technical analysis. Here is exactly why every professional trader monitors volume.
Confirms Trend Strength
A rising price with rising volume confirms the uptrend is strong and backed by genuine buying interest. Similarly, a falling price with rising volume confirms strong selling pressure. Without volume confirmation, trends can be deceptive.
Confirms Breakouts
A breakout above resistance with above-average volume is far more reliable than one with low volume. Volume is the primary filter that separates genuine breakouts from fake breakouts that trap unsuspecting retail traders.
Detects Reversals
Extreme volume spikes at the end of a trend often signal exhaustion. Climax volume — where volume reaches abnormal levels — frequently appears at market tops and bottoms, giving early warning of potential reversals.
Identifies Accumulation
When price consolidates in a range while volume gradually increases, smart money is likely accumulating shares. This often precedes a major upward move and is one of the most profitable setups in volume analysis.
Identifies Distribution
When price is at highs but volume starts showing unusual patterns — high volume on down days, low volume on up days — it signals distribution. Smart money is selling to retail buyers. This is a major warning sign.
Detects Smart Money
Institutions and large traders cannot hide their activity in volume data. Unusual volume spikes, block deals, large delivery percentages, and abnormal futures activity all leave footprints that trained volume analysts can detect and follow.
"Volume precedes price." — This is one of the oldest and most reliable principles in technical analysis. In many cases, volume changes occur before price changes, giving alert traders an edge. Watch for volume increases during consolidation — it often signals that a big move is about to happen.
Price and Volume Relationship Matrix
The four critical combinations of price and volume that every trader must memorize and understand deeply.
| Scenario | Price Direction | Volume | Interpretation | Signal |
|---|---|---|---|---|
| Scenario 1 | 📈 Price Up | 🔊 Volume Up | Strong buying interest. Trend confirmed. Institutions are participating. Bulls are in control with conviction. | Bullish ✅ |
| Scenario 2 | 📈 Price Up | 🔇 Volume Down | Price rising on weak participation. Lack of conviction. Rally may be unsustainable. Be cautious of a reversal. | Weak/Warning ⚠️ |
| Scenario 3 | 📉 Price Down | 🔊 Volume Up | Strong selling pressure. Panic selling or distribution by smart money. Downtrend has conviction and may continue. | Bearish ❌ |
| Scenario 4 | 📉 Price Down | 🔇 Volume Down | Selling drying up. Sellers are losing momentum. Potential bottom formation or consolidation phase beginning. | Neutral/Bottoming 🔄 |
Detailed Scenario Analysis
Scenario 1: Price Up + Volume Up (Bullish Confirmation)
This is the most bullish scenario. When the price is rising and the volume is increasing alongside, it means more and more participants are joining the buying frenzy. Institutional investors, mutual funds, and FIIs are likely adding to their positions. This is the ideal environment for trend-following strategies. Traders should look for pullbacks to enter long positions during such trends. The increasing volume validates that the uptrend has strong support and is not just a low-participation drift upward.
Scenario 2: Price Up + Volume Down (Warning Signal)
This is a tricky scenario that traps many retail traders. The price is going up, which looks bullish on the surface, but the decreasing volume tells a different story. It means fewer participants are driving the price higher. This often happens in the later stages of a rally when smart money has already started distributing (selling) and only retail traders are pushing the price up on thin volume. Professional traders treat this as a major warning signal and start tightening their stop losses or reducing position sizes.
Scenario 3: Price Down + Volume Up (Bearish Confirmation)
This is the most bearish scenario. Heavy selling with increasing volume suggests panic, forced liquidation, or deliberate distribution by large players. In the futures market, this could indicate aggressive short building. Traders should avoid catching falling knives in this scenario. Wait for volume to dry up (Scenario 4) before looking for bottom-fishing opportunities. This scenario often appears during news-driven sell-offs, earnings misses, or broader market corrections.
Scenario 4: Price Down + Volume Down (Potential Bottom)
When the price is falling but the volume is decreasing, it indicates that selling pressure is drying up. Sellers are losing interest, and the decline is happening more due to the absence of buyers than aggressive selling. This often marks the beginning of a consolidation or bottom formation phase. Sharp-eyed traders watch for a subsequent volume spike on the upside to confirm a reversal. This scenario is where value investors and swing traders often start building positions slowly.
How Volume Helps Different Traders
Volume analysis is valuable across all trading styles — from 1-minute scalping to multi-month positional trades.
Intraday Trading
For intraday traders, volume is essential for identifying the most active stocks, confirming intraday breakouts, and timing entries and exits. Key applications include trading only high-volume stocks for liquidity, using VWAP as an intraday anchor, confirming opening range breakouts with volume, identifying institutional orders via large volume candles, and avoiding low-volume afternoon sessions.
Swing Trading
Swing traders use volume to identify multi-day setups and confirm trend continuation or reversal patterns. Key applications include volume breakout from consolidation patterns, increasing volume on pullback bounces, OBV trend analysis, delivery volume percentage analysis, and volume profile support and resistance zones.
Positional Trading
Positional traders look at volume trends over weeks and months to identify accumulation or distribution phases. Key techniques include weekly volume trends for trend identification, bulk deal and block deal analysis, FII/DII daily buying and selling data, and relative volume comparison across sectors.
Options & Futures Trading
For derivative traders, volume combined with open interest provides the most powerful analysis framework. Key applications include futures volume plus OI for build-up analysis, option chain volume for strike selection, put-call volume ratio for sentiment, and volume-based entry and exit timing.
Volume Analysis for NSE Spot Market
Understanding spot volume on NSE — the primary exchange for Indian equities trading.
What is Spot Volume?
Spot volume refers to the actual trading volume in the cash market segment of the National Stock Exchange (NSE). Unlike futures and options, spot volume represents actual ownership transfer of shares. When you buy shares in the spot market, you are buying actual ownership of the company's equity. The volume in this segment reflects the genuine supply-demand dynamics and is the most authentic representation of market participation.
NSE publishes live volume data, turnover figures, market activity reports, and most-active contract data through its market-data sections. Traders can track volume trends using NSE's market activity dashboards and derivatives sections for comprehensive market analysis.
| Volume Type | Description | Significance | Use Case |
|---|---|---|---|
| High Volume Day | Volume significantly above 20-day average | Very High | Breakout confirmation, institutional activity |
| Low Volume Day | Volume below 50% of 20-day average | Low | Avoid trading, unreliable signals |
| Institutional Volume | Large block deals, bulk orders | Very High | Follow smart money, positional trades |
| Retail Volume | Small lots, scattered orders | Medium | Sentiment gauge, contrarian indicator |
| Delivery Volume | Shares actually delivered, not squared off | High | Genuine buying interest confirmation |
NSE publishes comprehensive market data including live volume, turnover, advance-decline data, and most-active securities through its official market data sections. Traders should regularly monitor NSE's market activity pages and derivatives dashboards to track volume trends, delivery percentages, and institutional participation metrics.
How to Import Volume Data
Six professional methods to import, track, and analyze volume data for your trading workflow.
Method 1: NSE Website Data
NSE provides daily bhavcopy data, market activity reports, and historical data downloads through its official website. Navigate to the market data section, select the desired date range, and download CSV files containing opening price, high, low, close, volume, and delivery data for all listed securities.
Method 2: Excel Import
Download the bhavcopy CSV file from NSE, open it in Microsoft Excel, and use Power Query or Data Import features to create an organized volume analysis dashboard. Use formulas like =AVERAGE(volume_range) for 20-day average volume, =volume/average_volume for relative volume, and conditional formatting to highlight above-average volume days.
Method 3: Google Sheets
Use the =GOOGLEFINANCE("NSE:SYMBOL","volume") function in Google Sheets to fetch live volume data for NSE-listed stocks. Create a volume watchlist by listing your tracked symbols and using GOOGLEFINANCE formulas to pull price, volume, and percentage change data.
Method 4: TradingView
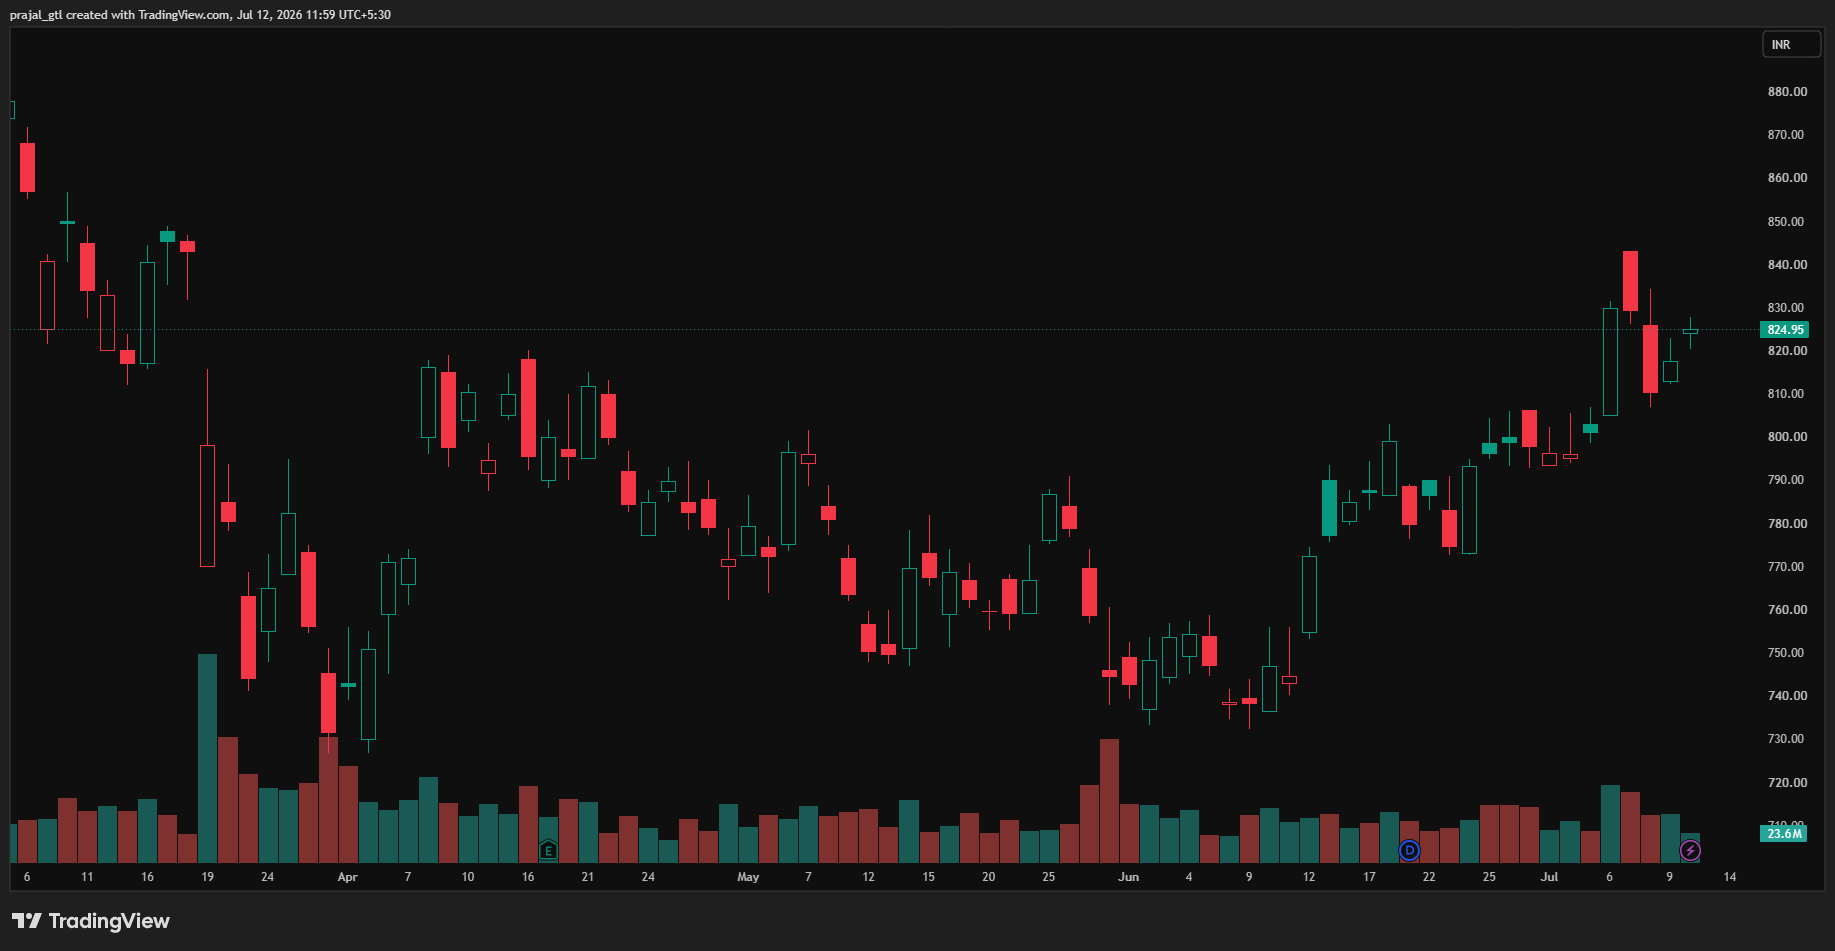
TradingView is the most popular charting platform for volume analysis. Add the Volume indicator to any chart, use Volume Profile for price-level analysis, and apply VWAP for intraday anchoring. TradingView also offers screeners where you can filter stocks by relative volume and breakout conditions.
Method 5: Broker API
Most Indian brokers provide APIs for accessing real-time and historical market data. Using platforms like Zerodha's Kite Connect, Angel One's SmartAPI, or Upstox API, you can programmatically fetch volume data, create automated volume alerts, and build custom dashboards.
Method 6: Python Data Fetching
Python is the most powerful tool for automated volume analysis. Use libraries like yfinance, nsepython, or jugaad_data to fetch historical volume data. Combine with pandas for data manipulation and plotly for visualization.
Important Index Volume Analysis
How professional traders analyze volume across major indices for market-wide trading decisions.
NIFTY 50 Volume Analysis
NIFTY 50 volume represents the aggregate participation across India's 50 largest companies. Analyzing NIFTY volume helps traders understand the overall market sentiment and institutional participation level. A high-volume NIFTY trend day indicates strong directional conviction from large players, while a low-volume drift suggests indecision and potential reversal.
BANK NIFTY Volume
Bank NIFTY is one of the most actively traded indices in the world. Its volume is dominated by institutional traders, proprietary desks, and algorithmic systems. Bank NIFTY volume analysis is critical because banking stocks are heavily weighted in the NIFTY 50 and often lead broader market moves.
Sector Volume & Market Breadth
Professional traders compare volume across sectors to identify sector rotation. When volume shifts from defensive sectors to aggressive sectors, it signals risk-on sentiment. Market breadth analysis involves comparing the volume of advancing stocks versus declining stocks for health assessment of market rallies.
| Index | Volume Significance | Key Analysis | Trading Use |
|---|---|---|---|
| NIFTY 50 | Overall market participation | Aggregate volume of top 50 stocks | Market direction, trend days |
| BANK NIFTY | Banking sector strength | Institutional banking activity | Options trading, sector rotation |
| FINNIFTY | Financial sector breadth | NBFC + Bank + Insurance volume | Financial sector trades |
| NIFTY IT | Technology sector interest | FII flow indicator | Global sentiment proxy |
| MIDCAP NIFTY | Risk appetite indicator | Retail + DII participation | Market breadth, retail sentiment |
Futures Volume Analysis Mastery
Understanding the powerful combination of futures volume and open interest for professional trading decisions.
What is Futures Volume?
Futures volume refers to the total number of futures contracts traded during a specific period. Unlike spot volume, futures volume involves leveraged positions where traders don't need to pay the full value of the underlying asset. This makes futures volume a critical indicator of leveraged conviction — traders are putting their money at higher risk, which means their actions carry more conviction.
Futures volume and derivatives activity are monitored through NSE derivative market statistics and turnover reports. Option volume is reported in contracts while option turnover represents premium turnover.
| Scenario | Price | Open Interest | Volume | Interpretation | Signal |
|---|---|---|---|---|---|
| Long Build-Up | ↑ Rising | ↑ Rising | High | New long positions being created. Strong bullish conviction. | Bullish ✅ |
| Short Build-Up | ↓ Falling | ↑ Rising | High | New short positions being created. Strong bearish conviction. | Bearish ❌ |
| Long Unwinding | ↓ Falling | ↓ Falling | Moderate | Longs are exiting. Profit booking or stop losses triggered. | Weak Bearish ⚠️ |
| Short Covering | ↑ Rising | ↓ Falling | High | Shorts are covering. Price rising due to short squeeze. | Temporary Bullish 🔄 |
The most powerful bullish signal is a Long Build-Up followed by a consolidation on low volume. This pattern often precedes the next leg of the rally. Similarly, the most powerful bearish signal is a Short Build-Up followed by any failed bounce attempt on declining volume.

How to Identify Big Player Entry
Detecting institutional buying, FII activity, smart money entry, and operator activity through volume analysis.
Real-World Example: Detecting Institutional Accumulation
Consider a stock trading at ₹500, consolidating between ₹490-510 for three weeks. During the first week, daily volume averages 2 lakh shares. In the second week, volume gradually increases to 4-5 lakh shares, but the price remains in the same range. In the third week, volume spikes to 8-10 lakh shares, with delivery percentage consistently above 65%. The stock then breaks above ₹510 on massive volume (15+ lakh shares) and rallies to ₹580.
This pattern shows classic institutional accumulation: quiet buying during consolidation (weeks 1-2), aggressive accumulation (week 3), and breakout when accumulation is complete. Volume-aware traders detected the accumulation and positioned themselves for the breakout.
Volume Breakout Trading Strategy
The most reliable and profitable volume-based trading strategy used by professional traders worldwide.
🎯 Volume Breakout Strategy — Complete Rules
If a breakout occurs on volume less than 1.5x average, treat it with extreme caution. Low-volume breakouts have a much higher failure rate. Beware of breakouts on expiry days or major news events — the volume spike may be event-driven rather than genuine accumulation.
Volume Reversal Strategy
How to use climax volume and exhaustion patterns to identify potential trend reversals.
Understanding Climax Volume
Climax volume occurs when trading volume reaches an extreme level — typically 4-5x or more of the average volume — at the end of a sustained trend. This extreme volume represents a final surge of participation where the last remaining buyers (in an uptrend) or sellers (in a downtrend) are entering the market. Once exhausted, there's nobody left to push the price further, leading to a reversal.
Selling Climax (Bottom Reversal)
A selling climax occurs after a prolonged downtrend when panic selling reaches a peak. Characteristics include extremely high volume (5-10x average), a wide-range bearish candle, price often gaps down, and heavy media pessimism. The next day often shows a dramatic reversal as all potential sellers have exhausted their selling.
Buying Climax (Top Reversal)
A buying climax occurs after a prolonged uptrend when euphoric buying reaches a peak. Characteristics include extremely high volume, the largest bullish candle in the entire trend, heavy media optimism, and retail FOMO. Smart money uses this extreme liquidity to distribute their holdings.
🔄 Volume Reversal Strategy — Entry Rules
Volume Traps Traders Must Avoid
Not all volume is reliable. Learn to identify and avoid these common volume traps that mislead traders.
News Volume
Volume spikes driven by breaking news are often unreliable for technical analysis. The volume is reactive, not institutional accumulation. Price often reverses after the initial news-driven spike. Wait for news volume to settle.
Fake Breakout Volume
Sometimes price breaks above resistance on moderately high volume but immediately reverses. This is a "bull trap" designed to lure retail breakout traders. Always verify breakout volume sustains for at least 2 sessions.
Expiry Volume
Monthly and weekly expiry days see artificially inflated volume due to position squaring and rollover. Volume on expiry day should not be used for regular volume analysis — it provides misleading signals.
Manipulation Volume
In small-cap stocks, operators can create artificial volume through circular trading. Always check if the volume spike has genuine delivery percentage increase. Circular trades typically have very low delivery.
Low Liquidity Volume
In illiquid stocks, even small orders can create volume spikes that look significant. A single block deal can spike volume 10x. Always consider absolute volume levels, not just relative changes.
Random Volume Spikes
Volume spikes from index rebalancing, mutual fund SIP dates, ETF creation, or unrelated block deals are random and should not be interpreted as directional signals.
End-of-Day Surges
The last 15-30 minutes often see volume surges due to MF NAV adjustments and closing auctions. This volume is often unrelated to genuine supply-demand dynamics.
Algo Trading Volume
High-frequency trading generates significant volume but involves rapid buying and selling within milliseconds. Look for volume that sustains over multiple candles rather than single-candle spikes.
Never make trading decisions based on volume alone. Volume must always be analyzed in conjunction with price action, candlestick patterns, support/resistance levels, and the broader market context. Develop the discipline to wait for volume + price + pattern confluence before entering any trade.
Best Volume Indicators
Eight essential volume indicators every trader should master for comprehensive volume analysis.
Volume Indicator (Basic)
The simplest volume indicator — displays raw volume bars below price chart. Green bars for up closes, red for down closes. Add a 20-period moving average line to identify above/below average volume. This is the foundation of all volume analysis.
Volume Profile
Displays volume at specific price levels as horizontal histogram. Point of Control (POC) — the highest volume price — acts as powerful magnet. High Volume Nodes are support/resistance zones. Low Volume Nodes are areas price moves through quickly.
VWAP
Volume Weighted Average Price calculates average price weighted by volume. Institutions use VWAP as benchmark for execution quality. Price above VWAP = bullish, below = bearish. Acts as dynamic intraday support/resistance.
OBV (On Balance Volume)
Cumulative indicator that adds volume on up days and subtracts on down days. Rising OBV confirms uptrend; falling confirms downtrend. OBV divergence from price is one of the most powerful early warning signals.
Accumulation/Distribution
The A/D line considers where close is relative to the high-low range, weighted by volume. Rising A/D with rising price confirms institutional buying. A/D divergence from price is a strong reversal signal.
Money Flow Index (MFI)
Volume-weighted RSI. Combines price and volume to measure buying/selling pressure on 0-100 scale. Above 80 = overbought, below 20 = oversold. More reliable than regular RSI because it incorporates volume.
Volume Oscillator
Calculates difference between fast and slow volume moving averages. Positive = short-term volume above longer-term average (bullish). Useful for identifying volume trends without daily noise.
Relative Volume (RVOL)
Compares current volume to average for same time period on previous days. RVOL above 1.5 = unusual interest, above 3.0 = extreme activity. Particularly useful for intraday traders identifying unusual real-time activity.
Volume Analysis Real Examples
Detailed, realistic trading examples demonstrating volume analysis in action across different market scenarios.
Common Volume Analysis Mistakes
Fifteen critical mistakes that traders make when analyzing volume — and how to avoid each one.
Ignoring Volume Completely
Many traders analyze only price, completely ignoring volume. This is like driving blind — volume provides context and confirmation that price alone cannot.
Using Absolute Volume Instead of Relative
Comparing raw volume across different stocks is meaningless. Always use relative volume (RVOL) — compare today's volume to its own average.
Trading Breakouts on Low Volume
Entering breakout trades without volume confirmation is the most common mistake. Low-volume breakouts fail at 60-70% rate.
Confusing Expiry Volume with Genuine Volume
Expiry days generate artificial volume spikes unrelated to genuine market sentiment. Avoid using expiry day volume for analysis.
Not Considering Delivery Volume
Total volume includes intraday squared-off volume. For genuine accumulation, delivery volume percentage is far more important.
Analyzing Volume in Isolation
Volume must always be analyzed with price action, support/resistance levels, trend direction, and broader market environment.
Ignoring Volume Divergences
When price makes new highs but OBV doesn't, it's a bearish divergence — one of the most powerful early warning signals most traders ignore.
Over-Relying on Single Volume Spikes
Single day spikes can be random. Look for volume trends over 3-5 sessions. Sustained increase is more significant than single spikes.
Not Adjusting for Market-Wide Events
On RBI policy days, budget, elections — entire market sees elevated volume. Adjust benchmarks for market-wide events.
Using Wrong Timeframe for Volume Analysis
Match your volume analysis timeframe to your trading timeframe. Intraday traders should compare intraday patterns, not daily averages.
Ignoring Options Volume
Options volume (especially put-call ratio and unusual options activity) provides crucial sentiment data many traders miss.
Not Tracking Volume Trends Over Time
Volume trends over weeks are more important than individual day readings. Consistently increasing volume signals growing institutional interest.
Chasing Stocks Based on Volume Alerts
By the time you see a "high volume" alert, the initial move may be done. Identify stocks with gradually increasing volume BEFORE breakout.
Misinterpreting Small-Cap Volume
Small-cap stocks are prone to manipulation. Apply stricter filters and insist on higher delivery percentages for small-cap analysis.
Not Maintaining a Volume Analysis Journal
Failing to document observations and outcomes prevents learning. Keep a journal noting volume signals, interpretations, actions, and results.
Professional Volume Analysis Checklist
A comprehensive checklist used by professional traders before every volume-based trade. Save this for reference.
Before entering any volume-based trade, tick at least 10-12 items for a high-conviction trade. If fewer than 8 are checked, reduce position size. Develop the discipline to use this checklist consistently — it will significantly improve your win rate.
Frequently Asked Questions
Comprehensive answers to the most common questions about volume analysis in stock trading.
Conclusion — Master Volume Analysis
Summary of Key Learnings
In this comprehensive Volume Analysis Trading Guide, we covered every aspect from beginner fundamentals to advanced professional techniques. Volume is the lifeblood of the market — it tells us how many participants are actively trading and whether price movements have genuine conviction.
The Price-Volume relationship (up-up, up-down, down-up, down-down) forms the foundation of all analysis. Volume confirms everything — breakouts need it, trends need it, reversals show up in volume before price.
Futures volume with Open Interest is the most powerful framework in derivatives. The four build-up scenarios give you a roadmap of institutional activity. Smart money always leaves footprints through delivery volume, block deals, VWAP, OBV trends, and futures data.
Not all volume is equal. Volume traps can mislead traders. Always apply the checklist before acting. Practice makes perfect — start with basic volume bars, add VWAP and OBV, then advance to Volume Profile. Keep a trading journal and continuously refine your volume reading skills.
Volume analysis, when mastered, gives you a significant edge over the majority of retail traders. It helps you trade with smart money, avoid traps, confirm entries, and improve your overall win rate. Make it a cornerstone of your trading methodology.
📚 Continue Your Trading Education
Explore more premium trading guides, strategies, and courses on Option Matrix India. Master the markets with professional knowledge and proven techniques.
📘 Published by Option Matrix India
Complete Volume Analysis Trading Guide — Beginner to Advanced
Published: January 15, 2025 | Last Updated: September 17, 2026 | 4500+ Words | 18 Sections | 15+ Strategies
Disclaimer: This article is for educational purposes only. Trading involves risk. Past performance does not guarantee future results. Please consult a SEBI registered investment advisor before making any trading decisions.
Volume Analysis Trading Guide — Complete Beginner to Advanced Course
Master Volume Analysis in Stock Trading. Learn Spot Volume, Futures Volume, Smart Money Detection, Institutional Activity, Breakout Confirmation, Volume Traps and Professional Trading Techniques with real examples.
What is Volume in Trading?
Understanding the fundamental building block of volume analysis — the total number of shares or contracts traded within a specific period.
Meaning of Trading Volume
Trading volume refers to the total number of shares, contracts, or units of a security that are bought and sold during a specific time period. It is one of the most critical metrics in technical analysis because it reveals the level of interest and participation in a particular stock, index, or derivative contract. Volume is essentially the lifeblood of the market — without volume, price movements lack conviction, and without understanding volume, traders operate blindly.
When you see a stock has traded 10 million shares in a day, that means 10 million shares were exchanged between buyers and sellers during that trading session. Each transaction involves a buyer and a seller. The buyer believes the price will go up, while the seller believes it will go down (or wants to book profit). This constant tug-of-war between buyers and sellers creates volume, and the analysis of this volume is what we call Volume Analysis.
How Volume is Generated
Volume is generated every time a trade is executed on the exchange. Here is the exact mechanism:
- A buyer places a buy order at a specific price (or market price)
- A seller places a sell order at the same or matching price
- The exchange matches these orders and executes the trade
- Each matched trade adds to the volume counter for that security
- If 500 shares are exchanged in one trade, volume increases by 500
Volume is always a two-sided metric. For every buyer, there is a seller. For every 1,000 shares bought, there are 1,000 shares sold. Volume counts total shares exchanged, not separately for buyers and sellers. Understanding this is critical for accurate volume analysis.
Volume vs Price Relationship
Price tells you where the market is moving. Volume tells you how strong that move is. Think of it this way: price is the car, and volume is the engine. A car can roll downhill without an engine (price can move on low volume), but for sustained uphill movement, you need a powerful engine (high volume). Professional traders always confirm price action with volume before making trading decisions.
Why Volume Matters in Trading
Volume is important because it provides crucial information that price alone cannot reveal:
- Confirmation: Volume confirms whether a price move is genuine or fake
- Strength: High volume indicates strong conviction among market participants
- Liquidity: Higher volume means easier entry and exit with minimal slippage
- Smart Money: Unusual volume often signals institutional or smart money activity
- Reversals: Extreme volume at key levels often signals potential trend reversals
- Breakouts: Volume is the primary confirmation tool for genuine breakouts
| Parameter | High Volume | Low Volume |
|---|---|---|
| Participation | Many buyers & sellers active | Few participants in market |
| Trend Reliability | High | Low |
| Breakout Validity | Genuine Breakout | Likely Fake |
| Liquidity | Easy entry & exit | Slippage risk high |
| Smart Money Signal | Possible Institutional Activity | Retail Dominated |
| Price Impact | Sustained moves | Choppy, random moves |
Why Volume is Critically Important
Volume is the single most important confirmation tool in technical analysis. Here is exactly why every professional trader monitors volume.
Confirms Trend Strength
A rising price with rising volume confirms the uptrend is strong and backed by genuine buying interest. Similarly, a falling price with rising volume confirms strong selling pressure. Without volume confirmation, trends can be deceptive.
Confirms Breakouts
A breakout above resistance with above-average volume is far more reliable than one with low volume. Volume is the primary filter that separates genuine breakouts from fake breakouts that trap unsuspecting retail traders.
Detects Reversals
Extreme volume spikes at the end of a trend often signal exhaustion. Climax volume — where volume reaches abnormal levels — frequently appears at market tops and bottoms, giving early warning of potential reversals.
Identifies Accumulation
When price consolidates in a range while volume gradually increases, smart money is likely accumulating shares. This often precedes a major upward move and is one of the most profitable setups in volume analysis.
Identifies Distribution
When price is at highs but volume starts showing unusual patterns — high volume on down days, low volume on up days — it signals distribution. Smart money is selling to retail buyers. This is a major warning sign.
Detects Smart Money
Institutions and large traders cannot hide their activity in volume data. Unusual volume spikes, block deals, large delivery percentages, and abnormal futures activity all leave footprints that trained volume analysts can detect and follow.
"Volume precedes price." — This is one of the oldest and most reliable principles in technical analysis. In many cases, volume changes occur before price changes, giving alert traders an edge. Watch for volume increases during consolidation — it often signals that a big move is about to happen.
Price and Volume Relationship Matrix
The four critical combinations of price and volume that every trader must memorize and understand deeply.
| Scenario | Price Direction | Volume | Interpretation | Signal |
|---|---|---|---|---|
| Scenario 1 | 📈 Price Up | 🔊 Volume Up | Strong buying interest. Trend confirmed. Institutions are participating. Bulls are in control with conviction. | Bullish ✅ |
| Scenario 2 | 📈 Price Up | 🔇 Volume Down | Price rising on weak participation. Lack of conviction. Rally may be unsustainable. Be cautious of a reversal. | Weak/Warning ⚠️ |
| Scenario 3 | 📉 Price Down | 🔊 Volume Up | Strong selling pressure. Panic selling or distribution by smart money. Downtrend has conviction and may continue. | Bearish ❌ |
| Scenario 4 | 📉 Price Down | 🔇 Volume Down | Selling drying up. Sellers are losing momentum. Potential bottom formation or consolidation phase beginning. | Neutral/Bottoming 🔄 |
Detailed Scenario Analysis
Scenario 1: Price Up + Volume Up (Bullish Confirmation)
This is the most bullish scenario. When the price is rising and the volume is increasing alongside, it means more and more participants are joining the buying frenzy. Institutional investors, mutual funds, and FIIs are likely adding to their positions. This is the ideal environment for trend-following strategies. Traders should look for pullbacks to enter long positions during such trends. The increasing volume validates that the uptrend has strong support and is not just a low-participation drift upward.
Scenario 2: Price Up + Volume Down (Warning Signal)
This is a tricky scenario that traps many retail traders. The price is going up, which looks bullish on the surface, but the decreasing volume tells a different story. It means fewer participants are driving the price higher. This often happens in the later stages of a rally when smart money has already started distributing (selling) and only retail traders are pushing the price up on thin volume. Professional traders treat this as a major warning signal and start tightening their stop losses or reducing position sizes.
Scenario 3: Price Down + Volume Up (Bearish Confirmation)
This is the most bearish scenario. Heavy selling with increasing volume suggests panic, forced liquidation, or deliberate distribution by large players. In the futures market, this could indicate aggressive short building. Traders should avoid catching falling knives in this scenario. Wait for volume to dry up (Scenario 4) before looking for bottom-fishing opportunities. This scenario often appears during news-driven sell-offs, earnings misses, or broader market corrections.
Scenario 4: Price Down + Volume Down (Potential Bottom)
When the price is falling but the volume is decreasing, it indicates that selling pressure is drying up. Sellers are losing interest, and the decline is happening more due to the absence of buyers than aggressive selling. This often marks the beginning of a consolidation or bottom formation phase. Sharp-eyed traders watch for a subsequent volume spike on the upside to confirm a reversal. This scenario is where value investors and swing traders often start building positions slowly.
How Volume Helps Different Traders
Volume analysis is valuable across all trading styles — from 1-minute scalping to multi-month positional trades.
Intraday Trading
For intraday traders, volume is essential for identifying the most active stocks, confirming intraday breakouts, and timing entries and exits. Key applications include trading only high-volume stocks for liquidity, using VWAP as an intraday anchor, confirming opening range breakouts with volume, identifying institutional orders via large volume candles, and avoiding low-volume afternoon sessions.
Swing Trading
Swing traders use volume to identify multi-day setups and confirm trend continuation or reversal patterns. Key applications include volume breakout from consolidation patterns, increasing volume on pullback bounces, OBV trend analysis, delivery volume percentage analysis, and volume profile support and resistance zones.
Positional Trading
Positional traders look at volume trends over weeks and months to identify accumulation or distribution phases. Key techniques include weekly volume trends for trend identification, bulk deal and block deal analysis, FII/DII daily buying and selling data, and relative volume comparison across sectors.
Options & Futures Trading
For derivative traders, volume combined with open interest provides the most powerful analysis framework. Key applications include futures volume plus OI for build-up analysis, option chain volume for strike selection, put-call volume ratio for sentiment, and volume-based entry and exit timing.
Volume Analysis for NSE Spot Market
Understanding spot volume on NSE — the primary exchange for Indian equities trading.
What is Spot Volume?
Spot volume refers to the actual trading volume in the cash market segment of the National Stock Exchange (NSE). Unlike futures and options, spot volume represents actual ownership transfer of shares. When you buy shares in the spot market, you are buying actual ownership of the company's equity. The volume in this segment reflects the genuine supply-demand dynamics and is the most authentic representation of market participation.
NSE publishes live volume data, turnover figures, market activity reports, and most-active contract data through its market-data sections. Traders can track volume trends using NSE's market activity dashboards and derivatives sections for comprehensive market analysis.
| Volume Type | Description | Significance | Use Case |
|---|---|---|---|
| High Volume Day | Volume significantly above 20-day average | Very High | Breakout confirmation, institutional activity |
| Low Volume Day | Volume below 50% of 20-day average | Low | Avoid trading, unreliable signals |
| Institutional Volume | Large block deals, bulk orders | Very High | Follow smart money, positional trades |
| Retail Volume | Small lots, scattered orders | Medium | Sentiment gauge, contrarian indicator |
| Delivery Volume | Shares actually delivered, not squared off | High | Genuine buying interest confirmation |
NSE publishes comprehensive market data including live volume, turnover, advance-decline data, and most-active securities through its official market data sections. Traders should regularly monitor NSE's market activity pages and derivatives dashboards to track volume trends, delivery percentages, and institutional participation metrics.
How to Import Volume Data
Six professional methods to import, track, and analyze volume data for your trading workflow.
Method 1: NSE Website Data
NSE provides daily bhavcopy data, market activity reports, and historical data downloads through its official website. Navigate to the market data section, select the desired date range, and download CSV files containing opening price, high, low, close, volume, and delivery data for all listed securities.
Method 2: Excel Import
Download the bhavcopy CSV file from NSE, open it in Microsoft Excel, and use Power Query or Data Import features to create an organized volume analysis dashboard. Use formulas like =AVERAGE(volume_range) for 20-day average volume, =volume/average_volume for relative volume, and conditional formatting to highlight above-average volume days.
Method 3: Google Sheets
Use the =GOOGLEFINANCE("NSE:SYMBOL","volume") function in Google Sheets to fetch live volume data for NSE-listed stocks. Create a volume watchlist by listing your tracked symbols and using GOOGLEFINANCE formulas to pull price, volume, and percentage change data.
Method 4: TradingView
TradingView is the most popular charting platform for volume analysis. Add the Volume indicator to any chart, use Volume Profile for price-level analysis, and apply VWAP for intraday anchoring. TradingView also offers screeners where you can filter stocks by relative volume and breakout conditions.
Method 5: Broker API
Most Indian brokers provide APIs for accessing real-time and historical market data. Using platforms like Zerodha's Kite Connect, Angel One's SmartAPI, or Upstox API, you can programmatically fetch volume data, create automated volume alerts, and build custom dashboards.
Method 6: Python Data Fetching
Python is the most powerful tool for automated volume analysis. Use libraries like yfinance, nsepython, or jugaad_data to fetch historical volume data. Combine with pandas for data manipulation and plotly for visualization.
Important Index Volume Analysis
How professional traders analyze volume across major indices for market-wide trading decisions.
NIFTY 50 Volume Analysis
NIFTY 50 volume represents the aggregate participation across India's 50 largest companies. Analyzing NIFTY volume helps traders understand the overall market sentiment and institutional participation level. A high-volume NIFTY trend day indicates strong directional conviction from large players, while a low-volume drift suggests indecision and potential reversal.
BANK NIFTY Volume
Bank NIFTY is one of the most actively traded indices in the world. Its volume is dominated by institutional traders, proprietary desks, and algorithmic systems. Bank NIFTY volume analysis is critical because banking stocks are heavily weighted in the NIFTY 50 and often lead broader market moves.
Sector Volume & Market Breadth
Professional traders compare volume across sectors to identify sector rotation. When volume shifts from defensive sectors to aggressive sectors, it signals risk-on sentiment. Market breadth analysis involves comparing the volume of advancing stocks versus declining stocks for health assessment of market rallies.
| Index | Volume Significance | Key Analysis | Trading Use |
|---|---|---|---|
| NIFTY 50 | Overall market participation | Aggregate volume of top 50 stocks | Market direction, trend days |
| BANK NIFTY | Banking sector strength | Institutional banking activity | Options trading, sector rotation |
| FINNIFTY | Financial sector breadth | NBFC + Bank + Insurance volume | Financial sector trades |
| NIFTY IT | Technology sector interest | FII flow indicator | Global sentiment proxy |
| MIDCAP NIFTY | Risk appetite indicator | Retail + DII participation | Market breadth, retail sentiment |
Futures Volume Analysis Mastery
Understanding the powerful combination of futures volume and open interest for professional trading decisions.
What is Futures Volume?
Futures volume refers to the total number of futures contracts traded during a specific period. Unlike spot volume, futures volume involves leveraged positions where traders don't need to pay the full value of the underlying asset. This makes futures volume a critical indicator of leveraged conviction — traders are putting their money at higher risk, which means their actions carry more conviction.
Futures volume and derivatives activity are monitored through NSE derivative market statistics and turnover reports. Option volume is reported in contracts while option turnover represents premium turnover.
| Scenario | Price | Open Interest | Volume | Interpretation | Signal |
|---|---|---|---|---|---|
| Long Build-Up | ↑ Rising | ↑ Rising | High | New long positions being created. Strong bullish conviction. | Bullish ✅ |
| Short Build-Up | ↓ Falling | ↑ Rising | High | New short positions being created. Strong bearish conviction. | Bearish ❌ |
| Long Unwinding | ↓ Falling | ↓ Falling | Moderate | Longs are exiting. Profit booking or stop losses triggered. | Weak Bearish ⚠️ |
| Short Covering | ↑ Rising | ↓ Falling | High | Shorts are covering. Price rising due to short squeeze. | Temporary Bullish 🔄 |
The most powerful bullish signal is a Long Build-Up followed by a consolidation on low volume. This pattern often precedes the next leg of the rally. Similarly, the most powerful bearish signal is a Short Build-Up followed by any failed bounce attempt on declining volume.
How to Identify Big Player Entry
Detecting institutional buying, FII activity, smart money entry, and operator activity through volume analysis.
Real-World Example: Detecting Institutional Accumulation
Consider a stock trading at ₹500, consolidating between ₹490-510 for three weeks. During the first week, daily volume averages 2 lakh shares. In the second week, volume gradually increases to 4-5 lakh shares, but the price remains in the same range. In the third week, volume spikes to 8-10 lakh shares, with delivery percentage consistently above 65%. The stock then breaks above ₹510 on massive volume (15+ lakh shares) and rallies to ₹580.
This pattern shows classic institutional accumulation: quiet buying during consolidation (weeks 1-2), aggressive accumulation (week 3), and breakout when accumulation is complete. Volume-aware traders detected the accumulation and positioned themselves for the breakout.
Volume Breakout Trading Strategy
The most reliable and profitable volume-based trading strategy used by professional traders worldwide.
🎯 Volume Breakout Strategy — Complete Rules
If a breakout occurs on volume less than 1.5x average, treat it with extreme caution. Low-volume breakouts have a much higher failure rate. Beware of breakouts on expiry days or major news events — the volume spike may be event-driven rather than genuine accumulation.
Volume Reversal Strategy
How to use climax volume and exhaustion patterns to identify potential trend reversals.
Understanding Climax Volume
Climax volume occurs when trading volume reaches an extreme level — typically 4-5x or more of the average volume — at the end of a sustained trend. This extreme volume represents a final surge of participation where the last remaining buyers (in an uptrend) or sellers (in a downtrend) are entering the market. Once exhausted, there's nobody left to push the price further, leading to a reversal.
Selling Climax (Bottom Reversal)
A selling climax occurs after a prolonged downtrend when panic selling reaches a peak. Characteristics include extremely high volume (5-10x average), a wide-range bearish candle, price often gaps down, and heavy media pessimism. The next day often shows a dramatic reversal as all potential sellers have exhausted their selling.
Buying Climax (Top Reversal)
A buying climax occurs after a prolonged uptrend when euphoric buying reaches a peak. Characteristics include extremely high volume, the largest bullish candle in the entire trend, heavy media optimism, and retail FOMO. Smart money uses this extreme liquidity to distribute their holdings.
🔄 Volume Reversal Strategy — Entry Rules
Volume Traps Traders Must Avoid
Not all volume is reliable. Learn to identify and avoid these common volume traps that mislead traders.
News Volume
Volume spikes driven by breaking news are often unreliable for technical analysis. The volume is reactive, not institutional accumulation. Price often reverses after the initial news-driven spike. Wait for news volume to settle.
Fake Breakout Volume
Sometimes price breaks above resistance on moderately high volume but immediately reverses. This is a "bull trap" designed to lure retail breakout traders. Always verify breakout volume sustains for at least 2 sessions.
Expiry Volume
Monthly and weekly expiry days see artificially inflated volume due to position squaring and rollover. Volume on expiry day should not be used for regular volume analysis — it provides misleading signals.
Manipulation Volume
In small-cap stocks, operators can create artificial volume through circular trading. Always check if the volume spike has genuine delivery percentage increase. Circular trades typically have very low delivery.
Low Liquidity Volume
In illiquid stocks, even small orders can create volume spikes that look significant. A single block deal can spike volume 10x. Always consider absolute volume levels, not just relative changes.
Random Volume Spikes
Volume spikes from index rebalancing, mutual fund SIP dates, ETF creation, or unrelated block deals are random and should not be interpreted as directional signals.
End-of-Day Surges
The last 15-30 minutes often see volume surges due to MF NAV adjustments and closing auctions. This volume is often unrelated to genuine supply-demand dynamics.
Algo Trading Volume
High-frequency trading generates significant volume but involves rapid buying and selling within milliseconds. Look for volume that sustains over multiple candles rather than single-candle spikes.
Never make trading decisions based on volume alone. Volume must always be analyzed in conjunction with price action, candlestick patterns, support/resistance levels, and the broader market context. Develop the discipline to wait for volume + price + pattern confluence before entering any trade.
Best Volume Indicators
Eight essential volume indicators every trader should master for comprehensive volume analysis.
Volume Indicator (Basic)
The simplest volume indicator — displays raw volume bars below price chart. Green bars for up closes, red for down closes. Add a 20-period moving average line to identify above/below average volume. This is the foundation of all volume analysis.
Volume Profile
Displays volume at specific price levels as horizontal histogram. Point of Control (POC) — the highest volume price — acts as powerful magnet. High Volume Nodes are support/resistance zones. Low Volume Nodes are areas price moves through quickly.
VWAP
Volume Weighted Average Price calculates average price weighted by volume. Institutions use VWAP as benchmark for execution quality. Price above VWAP = bullish, below = bearish. Acts as dynamic intraday support/resistance.
OBV (On Balance Volume)
Cumulative indicator that adds volume on up days and subtracts on down days. Rising OBV confirms uptrend; falling confirms downtrend. OBV divergence from price is one of the most powerful early warning signals.
Accumulation/Distribution
The A/D line considers where close is relative to the high-low range, weighted by volume. Rising A/D with rising price confirms institutional buying. A/D divergence from price is a strong reversal signal.
Money Flow Index (MFI)
Volume-weighted RSI. Combines price and volume to measure buying/selling pressure on 0-100 scale. Above 80 = overbought, below 20 = oversold. More reliable than regular RSI because it incorporates volume.
Volume Oscillator
Calculates difference between fast and slow volume moving averages. Positive = short-term volume above longer-term average (bullish). Useful for identifying volume trends without daily noise.
Relative Volume (RVOL)
Compares current volume to average for same time period on previous days. RVOL above 1.5 = unusual interest, above 3.0 = extreme activity. Particularly useful for intraday traders identifying unusual real-time activity.
Volume Analysis Real Examples
Detailed, realistic trading examples demonstrating volume analysis in action across different market scenarios.
Common Volume Analysis Mistakes
Fifteen critical mistakes that traders make when analyzing volume — and how to avoid each one.
Ignoring Volume Completely
Many traders analyze only price, completely ignoring volume. This is like driving blind — volume provides context and confirmation that price alone cannot.
Using Absolute Volume Instead of Relative
Comparing raw volume across different stocks is meaningless. Always use relative volume (RVOL) — compare today's volume to its own average.
Trading Breakouts on Low Volume
Entering breakout trades without volume confirmation is the most common mistake. Low-volume breakouts fail at 60-70% rate.
Confusing Expiry Volume with Genuine Volume
Expiry days generate artificial volume spikes unrelated to genuine market sentiment. Avoid using expiry day volume for analysis.
Not Considering Delivery Volume
Total volume includes intraday squared-off volume. For genuine accumulation, delivery volume percentage is far more important.
Analyzing Volume in Isolation
Volume must always be analyzed with price action, support/resistance levels, trend direction, and broader market environment.
Ignoring Volume Divergences
When price makes new highs but OBV doesn't, it's a bearish divergence — one of the most powerful early warning signals most traders ignore.
Over-Relying on Single Volume Spikes
Single day spikes can be random. Look for volume trends over 3-5 sessions. Sustained increase is more significant than single spikes.
Not Adjusting for Market-Wide Events
On RBI policy days, budget, elections — entire market sees elevated volume. Adjust benchmarks for market-wide events.
Using Wrong Timeframe for Volume Analysis
Match your volume analysis timeframe to your trading timeframe. Intraday traders should compare intraday patterns, not daily averages.
Ignoring Options Volume
Options volume (especially put-call ratio and unusual options activity) provides crucial sentiment data many traders miss.
Not Tracking Volume Trends Over Time
Volume trends over weeks are more important than individual day readings. Consistently increasing volume signals growing institutional interest.
Chasing Stocks Based on Volume Alerts
By the time you see a "high volume" alert, the initial move may be done. Identify stocks with gradually increasing volume BEFORE breakout.
Misinterpreting Small-Cap Volume
Small-cap stocks are prone to manipulation. Apply stricter filters and insist on higher delivery percentages for small-cap analysis.
Not Maintaining a Volume Analysis Journal
Failing to document observations and outcomes prevents learning. Keep a journal noting volume signals, interpretations, actions, and results.
Professional Volume Analysis Checklist
A comprehensive checklist used by professional traders before every volume-based trade. Save this for reference.
Before entering any volume-based trade, tick at least 10-12 items for a high-conviction trade. If fewer than 8 are checked, reduce position size. Develop the discipline to use this checklist consistently — it will significantly improve your win rate.
Frequently Asked Questions
Comprehensive answers to the most common questions about volume analysis in stock trading.
Conclusion — Master Volume Analysis
Summary of Key Learnings
In this comprehensive Volume Analysis Trading Guide, we covered every aspect from beginner fundamentals to advanced professional techniques. Volume is the lifeblood of the market — it tells us how many participants are actively trading and whether price movements have genuine conviction.
The Price-Volume relationship (up-up, up-down, down-up, down-down) forms the foundation of all analysis. Volume confirms everything — breakouts need it, trends need it, reversals show up in volume before price.
Futures volume with Open Interest is the most powerful framework in derivatives. The four build-up scenarios give you a roadmap of institutional activity. Smart money always leaves footprints through delivery volume, block deals, VWAP, OBV trends, and futures data.
Not all volume is equal. Volume traps can mislead traders. Always apply the checklist before acting. Practice makes perfect — start with basic volume bars, add VWAP and OBV, then advance to Volume Profile. Keep a trading journal and continuously refine your volume reading skills.
Volume analysis, when mastered, gives you a significant edge over the majority of retail traders. It helps you trade with smart money, avoid traps, confirm entries, and improve your overall win rate. Make it a cornerstone of your trading methodology.
📚 Continue Your Trading Education
Explore more premium trading guides, strategies, and courses on Option Matrix India. Master the markets with professional knowledge and proven techniques.
📘 Published by Option Matrix India
Complete Volume Analysis Trading Guide — Beginner to Advanced
Published: January 15, 2025 | Last Updated: September 17, 2026 | 4500+ Words | 18 Sections | 15+ Strategies
Disclaimer: This article is for educational purposes only. Trading involves risk. Past performance does not guarantee future results. Please consult a SEBI registered investment advisor before making any trading decisions.