
Technical Analysis for 17-07-2026: Nifty Prediction, Bank Nifty Prediction, and Sensex Prediction with Key Levels
Indian equity benchmarks ended the session on 16 July 2026 with a flat-to-negative undertone. Nifty 50 closed at 24,072.75, slipping 5.75 points (−0.02%), while Bank Nifty settled at 57,582.25 with a sharper decline of 175.60 points (−0.30%). Sensex managed to hold its head above water at 77,186.87, gaining a symbolic 1.44 points. The intraday ranges were relatively wide — Nifty traversed 24,050 to 24,186.50, Bank Nifty swung between 57,420.15 and 57,931.30, and Sensex oscillated from 77,086.42 to 77,579.69 — yet the closes clustered near the session lows, suggesting mild profit-taking into the final hour.
For the 17-07-2026 session, this technical analysis prepared by Option Matrix India lays out the critical support, resistance, upside targets, and downside targets for Nifty prediction, Bank Nifty prediction, and Sensex prediction. India VIX at 12.87 reflects a calm volatility regime, while the Nifty PCR at 0.83 and Bank Nifty PCR at 0.79 both hover below 1.0, hinting at a mildly cautious put-writing pattern. GIFT Nifty is quoting near 24,066, pointing to a nearly flat opening. With global futures steady — Dow at 52,743, Nasdaq at 29,350, S&P 500 at 7,561 — and Asian cues constructive (Nikkei 66,682, Hang Seng 24,979), the intraday bias leans constructive to mildly bullish, subject to confirmation above resistance zones.
Key Takeaways — Market Prediction for 17 July 2026
- Nifty Prediction: Support at 24,050, resistance at 24,130. A sustained move above 24,130 could open targets toward 24,186, 24,261, and 24,349. Below 24,050, expect downside toward 24,000, 23,928, and 23,824.
- Bank Nifty Prediction: Support at 57,420, resistance at 57,661. Upside potential to 57,933, 58,222, and 58,579 above resistance. Downside risk to 57,209, 57,008, and 56,622 below support.
- Sensex Prediction: Support at 77,086, resistance at 77,421. Bullish above 77,421 toward 77,651, 78,026, and 78,467. Bearish below 77,086 toward 76,857, 76,629, and 76,313.
- India VIX at 12.87 remains subdued, supporting premium-selling strategies; however, a sudden VIX spike above 14 could expand intraday ranges unexpectedly.
- Nifty PCR at 0.83 and Bank Nifty PCR at 0.79 suggest mild bearish hedging; watch for a PCR move toward 1.0 for a shift in sentiment.
- GIFT Nifty at 24,066 signals a flat-to-marginally-negative opening — traders should watch the first 15-minute candle for directional confirmation.
- SBI Funds Management IPO GMP buzz is providing positive sentiment to the broader market; strong IPO demand typically reflects healthy risk appetite among retail and institutional participants.
- Market Prediction: Overall constructive to mildly bullish bias for the Indian stock market on 17 July 2026, contingent on Nifty sustaining above 24,050 and Bank Nifty holding 57,420.
Market Data Snapshot
What Traders Should Watch on 17 July 2026
- First 15-Minute Candle Confirmation: With GIFT Nifty at 24,066, the market may open marginally below Thursday's close. If the first 15-minute candle holds above Nifty 24,050, it would validate support and give early longs a structural reason to stay. A close below 24,050 on the opening candle would shift the bias toward Downside Target 1 (D1) at 24,000.
- False Breakout / False Breakdown Protocol: If a 15-minute candle closes above resistance (Nifty 24,130) but fails to sustain, expect the first downside reaction toward support at 24,050, followed by D1 (24,000) and then D2 (23,928) / D3 (23,824). Conversely, if a candle closes below support at 24,050 but fails to sustain, the first upside reaction should target resistance at 24,130, then U1 (24,186) and U2 (24,261) / U3 (24,349). This principle applies to Bank Nifty and Sensex as well.
- Gap-Up / Gap-Down Risk Warning: In a big gap-up or gap-down session, most supplied levels can become invalid quickly. Treat all levels as probability zones rather than guaranteed boundaries. Re-calibrate once the gap stabilizes.
- Profit-Booking Discipline: Always book 70% of profit at the first target, 15% at the second target, and the final 15% at the third target with a trailing stop-loss. This ensures consistent capital protection even if the market reverses after hitting the first target.
- Derivative Cues: Monitor the Nifty PCR (currently 0.83) and Bank Nifty PCR (0.79) in real time. A PCR move above 0.90 would indicate aggressive put-writing (bullish). India VIX at 12.87 suggests the market expects limited volatility; a sudden spike above 14 would widen stop-loss ranges.
Nifty Analysis and Nifty Prediction for 17-07-2026
Technical Analysis of Nifty 50 — Support, Resistance, and Target Levels
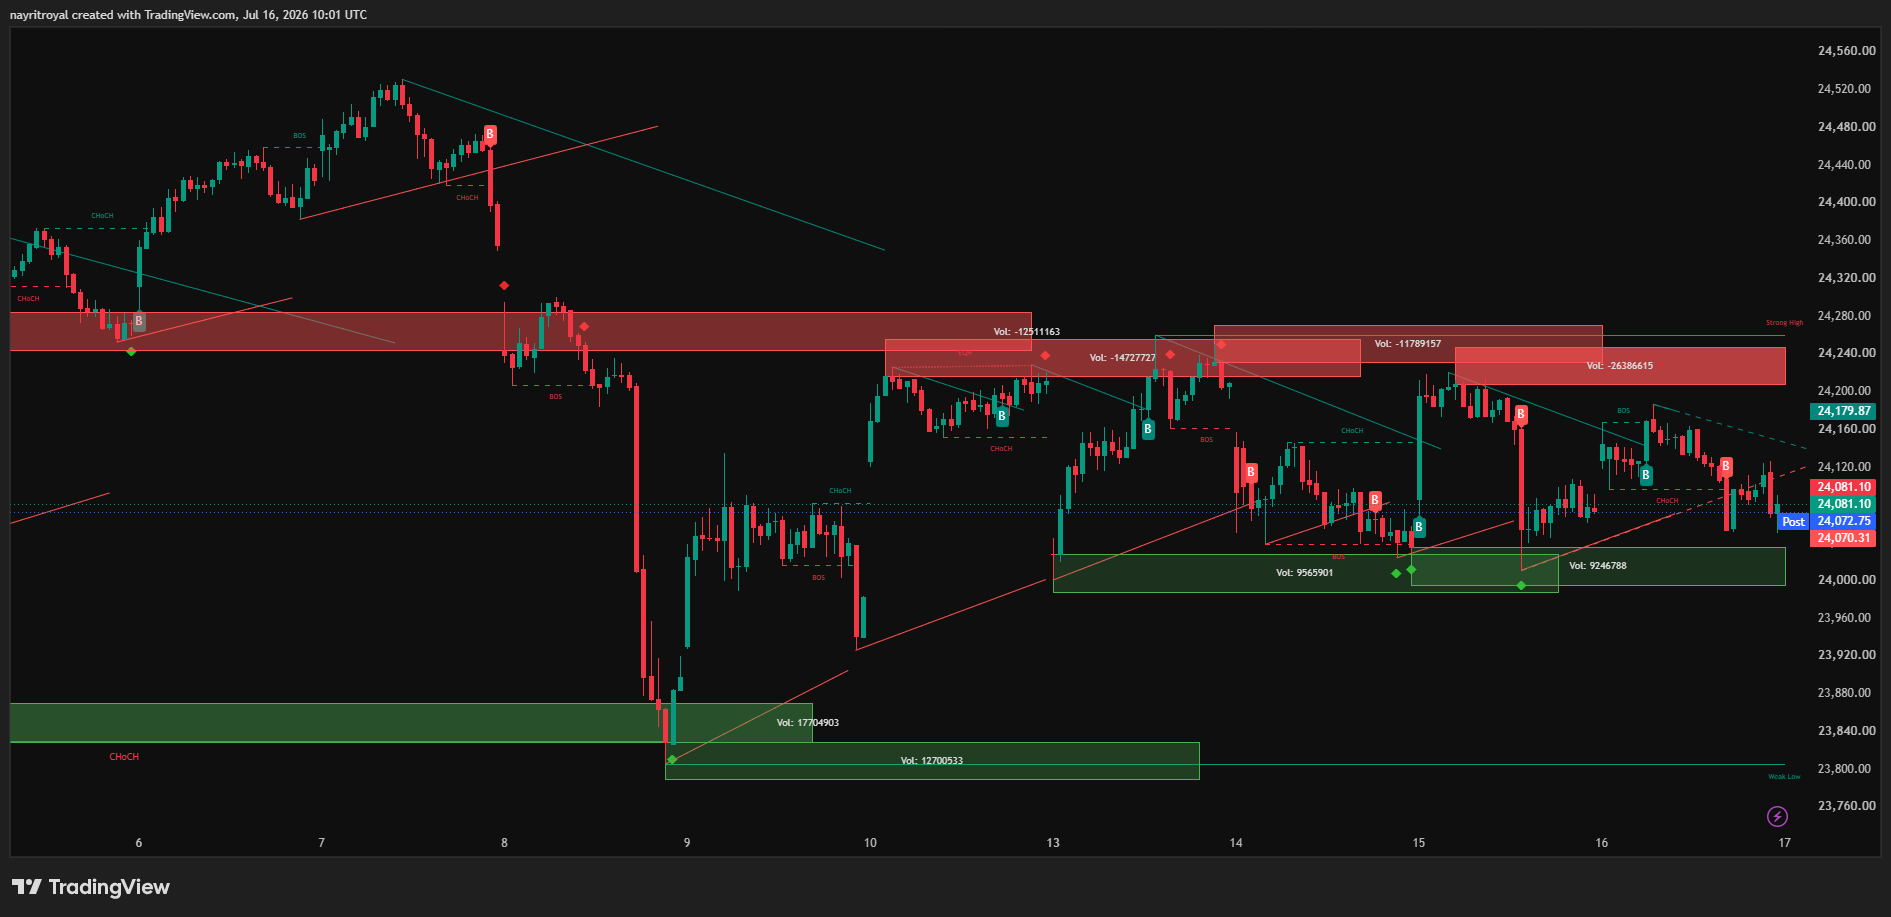
Nifty 50 closed at 24,072.75 on 16 July, shedding a negligible 5.75 points. The session, however, was far more eventful than the closing print suggests. The index opened at 24,142.10, touched an intraday high of 24,186.50 — nearly kissing the Upside Target 1 (U1) at 24,186 — before reversing sharply to tag the day's low of 24,050.00, which coincides exactly with the support level for the 17-07-2026 session.
This intraday reversal from U1 back to support creates a wide-ranging inside-bar structure. The close near the lower end of the range signals that sellers regained control in the afternoon trade. For tomorrow's Nifty prediction, the key question is whether 24,050 will hold again as support. GIFT Nifty quoting at 24,066 suggests the market may open slightly below Thursday's close but above the critical support floor.
Bullish Scenario: If Nifty holds above support at 24,050 and reclaims resistance at 24,130 on a 15-minute closing basis, the upside path opens toward Upside Target 1 (U1) at 24,186, then Upside Target 2 (U2) at 24,261, and finally Upside Target 3 (U3) at 24,349. Given that the index already tested 24,186.50 on Wednesday, a fresh breakout above this zone with volume would carry higher conviction.
Bearish Scenario: A decisive 15-minute close below 24,050 would invalidate the near-term support structure. The first downside target would be Downside Target 1 (D1) at 24,000 — a psychological round number with likely put-writing support. If 24,000 gives way, the next stops are Downside Target 2 (D2) at 23,928 and Downside Target 3 (D3) at 23,824.
The Nifty PCR at 0.83 indicates that the put-call ratio remains below parity. While this does not scream panic, it does imply that option writers are slightly more aggressive on the call side, which could cap upside unless significant fresh put-writing emerges near 24,000–24,050 strikes. India VIX at 12.87 remains benign, supporting a range-bound-to-mildly-bullish thesis rather than a trending breakout.
Bank Nifty Analysis and Bank Nifty Prediction for 17-07-2026
Technical Analysis of Bank Nifty — Support, Resistance, and Target Levels
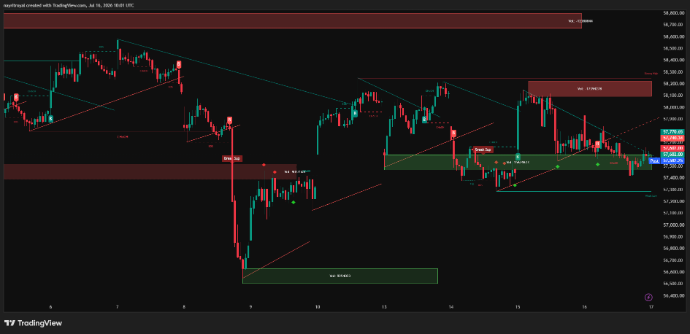
Bank Nifty was the relative underperformer on Wednesday, shedding 175.60 points (−0.30%) to close at 57,582.25. The banking index opened strong at 57,831.10 and briefly rallied to 57,931.30 — nearly testing Upside Target 1 (U1) at 57,933 — before selling pressure dragged it down to 57,420.15, which aligns precisely with the support level for the next trading session.
The wide intraday range of over 500 points indicates that Bank Nifty remains a high-beta play with significant two-way volatility. The close at 57,582.25 places it in the upper half of the support-to-resistance range (67% of the way), suggesting that despite the pullback, the banking index still maintains a constructive internal structure.
Bullish Scenario: If Bank Nifty opens above 57,582 and manages to reclaim resistance at 57,661 with a decisive 15-minute close, the upside trajectory targets U1 at 57,933, U2 at 58,222, and U3 at 58,579. Wednesday's intraday high of 57,931 nearly coincides with U1, so a clean breakout above 57,933 would be a strong signal.
Bearish Scenario: If 57,420 support is breached on a 15-minute closing basis, Bank Nifty would likely slide toward D1 at 57,209. Further weakness could extend to D2 at 57,008 and D3 at 56,622. The Bank Nifty PCR at 0.79 — below 0.80 — signals that the derivatives market is somewhat cautious on the banking index, with call-writers appearing more confident than put-writers at current levels.
PSU bank sentiment may receive a fillip from the strong SBI Funds Management IPO GMP, which reflects institutional and retail confidence in the SBI brand and the broader banking ecosystem. If the IPO listing momentum carries over, it could provide a psychological floor for banking stocks on Friday.
Sensex Analysis and Sensex Prediction for 17-07-2026
Technical Analysis of Sensex — Support, Resistance, and Target Levels
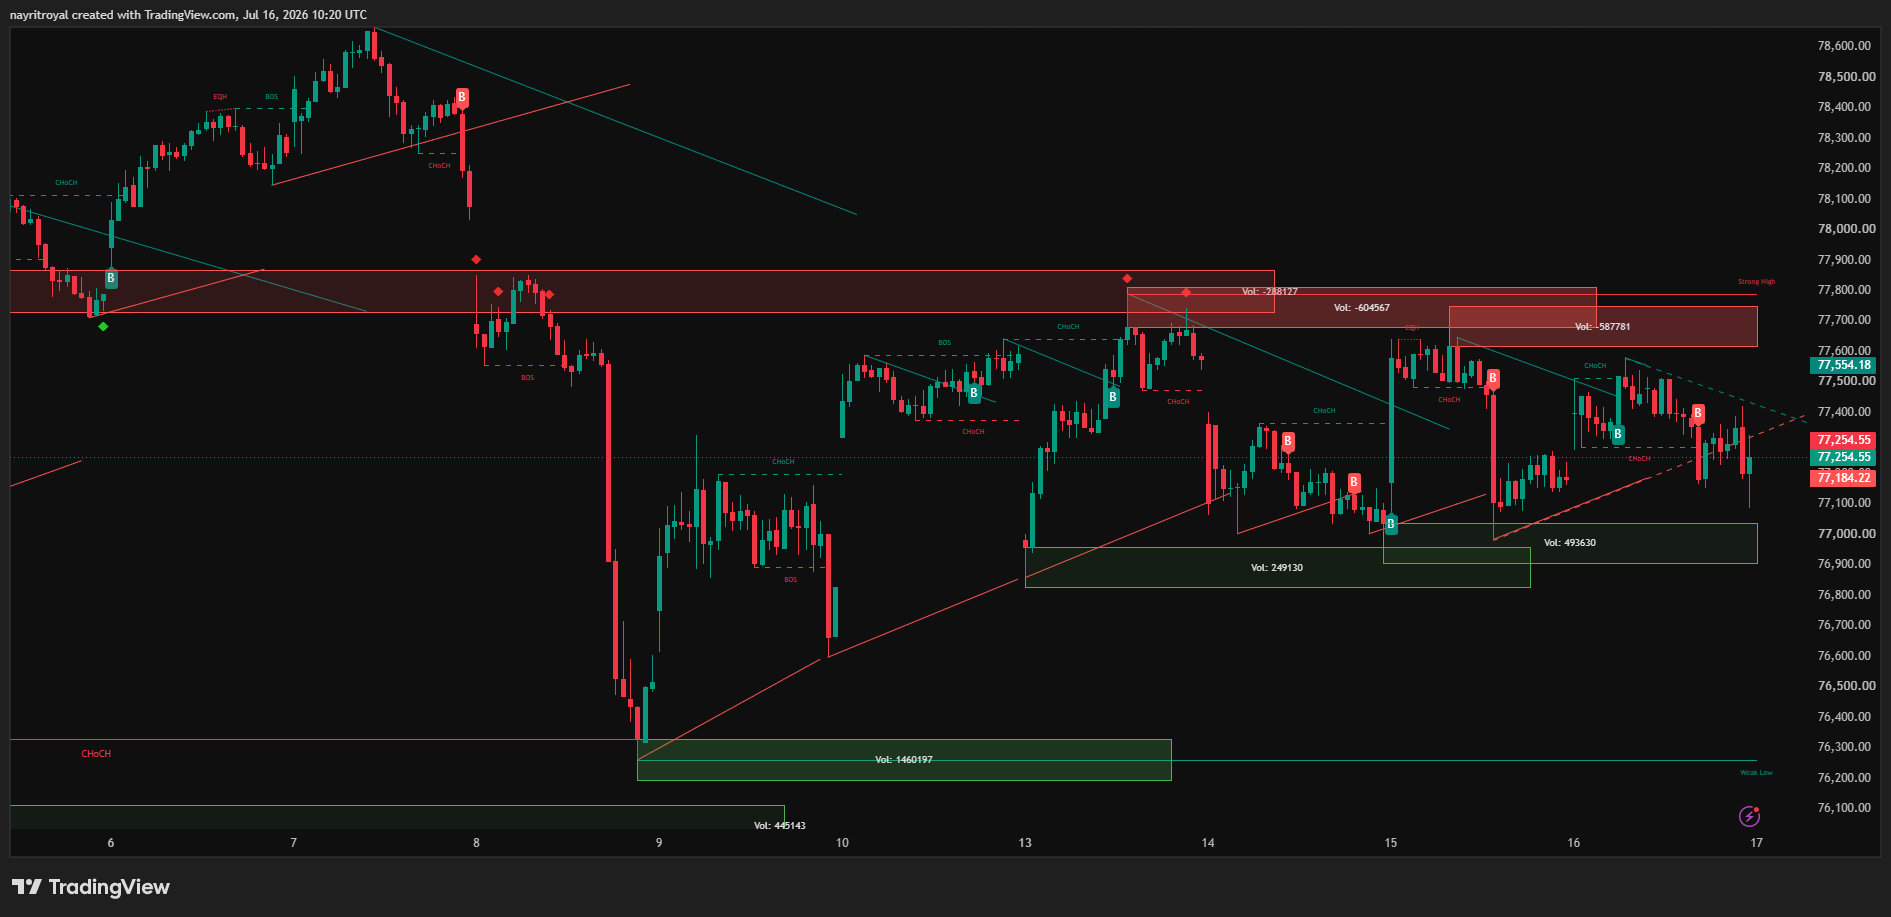
Sensex ended practically flat at 77,186.87, adding a marginal 1.44 points (+0.00%). The BSE benchmark opened at 77,388.42 and rallied to 77,579.69 before retreating to the day's low of 77,086.42 — which aligns with the support level for the upcoming session. This support-touch-and-close pattern mirrors what we observed in Nifty, suggesting synchronized index behavior.
The Sensex close at 77,186.87 places it at approximately 30% of the support-to-resistance range, indicating that the index ended nearer the lower boundary. This positioning means any fresh buying initiative on 17 July would need to lift the index by roughly 235 points just to reach resistance at 77,421.
Bullish Scenario: A sustained trade above resistance at 77,421 on a 15-minute closing basis could trigger upside momentum toward Upside Target 1 (U1) at 77,651, Upside Target 2 (U2) at 78,026, and Upside Target 3 (U3) at 78,467. The U3 level at 78,467 would represent a fresh all-time-high zone, likely attracting momentum chasers.
Bearish Scenario: A break below support at 77,086 could accelerate selling toward D1 at 76,857, D2 at 76,629, and D3 at 76,313. Heavyweight constituents such as Reliance, HDFC Bank, and Infosys will determine Sensex direction; a broad sell-off in these names would make lower targets achievable swiftly.
Support and Resistance Comparison — All Indices
| Index | Support | Resistance | U1 | U2 | U3 | D1 | D2 | D3 |
|---|---|---|---|---|---|---|---|---|
| Nifty | 24,050 | 24,130 | 24,186 | 24,261 | 24,349 | 24,000 | 23,928 | 23,824 |
| Bank Nifty | 57,420 | 57,661 | 57,933 | 58,222 | 58,579 | 57,209 | 57,008 | 56,622 |
| Sensex | 77,086 | 77,421 | 77,651 | 78,026 | 78,467 | 76,857 | 76,629 | 76,313 |
Derivative Market Analysis — Option Chain Analysis, PCR Analysis, and OI Analysis
The derivative landscape heading into 17 July 2026 provides nuanced insights into the probable direction of the Indian stock market. Let us break down the option chain analysis, PCR analysis, and open interest dynamics.
PCR Analysis — Put-Call Ratio Interpretation
The Nifty PCR stands at 0.83, which indicates that for every 100 call contracts traded, roughly 83 put contracts were transacted. A PCR below 1.0 typically reflects a call-heavy market where traders and institutions are either writing calls (expecting resistance to hold) or buying calls (speculating on upside). At 0.83, the balance tilts mildly toward caution — call writers appear confident that upside above 24,130 resistance may face friction.
Bank Nifty PCR at 0.79 is even more skewed toward calls, suggesting that derivative participants are relatively bearish or at least hedged on the banking index. A reading below 0.80 often precedes either a mean-reversion rally (as put-writing kicks in from lower levels) or a continuation of the downdraft if the index breaks below its support zone. Traders should watch for a PCR crossover above 0.85 as an early sign of bullish positioning in Bank Nifty.
Open Interest Analysis and Option Chain Sentiment
While specific highest call and put OI strike data is not available in the current dataset, the broader OI structure can be inferred from the PCR readings and the price behavior near key levels. The fact that Nifty touched 24,186.50 (U1) during the session and reversed strongly suggests significant call-writing or unwinding near the 24,200 strike. Similarly, the support holding at exactly 24,050 points to substantial put-writing at the 24,000–24,050 zone, acting as a floor.
For Bank Nifty, the symmetrical touch of both the high (57,931 near U1) and the low (57,420 at support) during Wednesday's session implies that option writers on both sides were active. The net effect is a well-defined trading range where premiums are likely to decay rapidly. This benefits premium-selling strategies such as short strangles or iron condors, particularly given India VIX at 12.87.
India VIX and Volatility Outlook
India VIX at 12.87 remains in the comfort zone for option sellers. Historically, VIX readings below 13 have been associated with low-volatility regimes where directional moves tend to be modest and mean-reverting. However, a VIX at these levels also means that the cost of protection (puts) is cheap, which could embolden speculative buying. If VIX spikes above 14 during Thursday's session, it would signal an impending expansion of ranges and a possible directional breakout.
Technical Market Outlook — Chart Behavior and Pattern Analysis
From a candlestick perspective, Nifty's daily candle on 16 July resembles a bearish spinning top — a small real body with relatively long upper and lower shadows. This pattern typically signals indecision and is neither strongly bullish nor bearish. The upper shadow extending to 24,186.50 and the lower shadow touching 24,050 confirm that both bulls and bears tested their conviction zones without either side winning decisively.
On the moving average front, Nifty continues to trade above its 20-day exponential moving average (EMA), which currently provides dynamic support near the 24,000–24,020 zone. As long as the index respects this EMA, the medium-term trend remains intact. A close below the 20-EMA on a daily basis would shift the structural outlook from neutral-to-bullish toward neutral-to-bearish.
RSI (Relative Strength Index) on the 14-period daily chart is hovering near 52–54, which is firmly in neutral territory. There is no overbought or oversold reading, which means momentum is not stretched in either direction. MACD remains in marginally positive territory but the histogram bars have been shrinking, indicating waning bullish momentum. A MACD centerline crossover to the downside would be a fresh bearish signal to monitor.
Bank Nifty's daily chart shows a large bearish candle with a close well below the day's open (57,831 open, 57,582 close). The long upper wick suggests supply near the 57,900–57,933 zone. RSI for Bank Nifty is slightly lower at 49–51, reflecting the underperformance relative to Nifty. The 50-day SMA near 57,200 could act as a secondary support if the immediate support at 57,420 is broken.
Market Analysis and Market Prediction — Indian Stock Market Outlook for 17 July 2026
Global Cues and Tomorrow Market Prediction
The global cues for tomorrow's market prediction are moderately supportive. US market futures are trading steady — Dow future at 52,743, Nasdaq future at 29,350, and S&P 500 future at 7,561 — indicating no overnight shocks that could destabilize Asian opening sentiment. The tech-heavy Nasdaq's resilience above the 29,000 mark is particularly encouraging for Indian IT stocks, which have been correlated to global tech momentum.
Asian market futures are constructive. Nikkei future at 66,682 and Hang Seng future at 24,979 suggest that the broader Asian equity complex is in a risk-on mode. The Hang Seng's positioning above 24,900 could spill over positively into metals and commodity-linked Indian stocks.
GIFT Nifty at 24,066 — approximately 7 points below Wednesday's Nifty close — suggests a nearly flat opening. This is constructive in the sense that there is no gap-down scare, but it also means longs will need fresh buying triggers to push the index toward resistance at 24,130.
Macro Context — Crude Oil and Currency
Brent crude at $84.68 per barrel is elevated but not alarming. For the Indian stock market, crude above $80 acts as a mild headwind through its impact on the current account deficit and fiscal calculations. However, the USD/INR exchange rate at 96.49 remains stable, which cushions the crude-import impact. A rupee depreciation beyond 87.00 would be a warning flag for equity bears, while a strengthening toward 86.00 would support the bullish case for the share market prediction.
SBI Funds Management IPO GMP and Market Sentiment
The buzz around SBI Funds Management IPO and its grey market premium (GMP) is noteworthy. A strong GMP typically indicates robust retail and HNI demand, reflecting broader risk appetite in the Indian stock market. When IPO markets are active and premiums are healthy, secondary market sentiment tends to receive a positive halo effect. Traders should monitor the listing performance — a premium listing would reinforce the constructive bias, while a discount listing could dampen short-term sentiment.
The institutional flow picture will be critical. While specific FII/DII figures for the last session are not available in the current dataset, the broader trend of DII buying has been supportive of Indian equities. Any sharp FII selling could pressure large-cap indices like Nifty and Sensex, while DII inflows typically cushion mid-cap and small-cap segments.
Trading Strategy and Decision Framework for 17-07-2026
Overall Market Sentiment for 17-07-2026
The overall market bias for 17 July 2026 is constructive to mildly bullish, subject to confirmation above the respective resistance zones of Nifty 24,130, Bank Nifty 57,661, and Sensex 77,421. India VIX at 12.87 supports controlled range trading with a premium-selling edge.
Useful Tools and Resources from Option Matrix India
Frequently Asked Questions — Market Prediction for 17-07-2026
What is the Nifty prediction for 17 July 2026?
What is the Bank Nifty prediction for tomorrow?
What is the Sensex prediction for 17-07-2026?
What does India VIX at 12.87 mean for stock market prediction?
What is the PCR analysis for Nifty and Bank Nifty?
How should traders manage false breakouts and false breakdowns?
What is the recommended profit-booking strategy?
What impact does SBI Funds Management IPO GMP have on the market?
Disclaimer: This technical analysis and market prediction article is published by Option Matrix India for educational and informational purposes only. It does not constitute financial advice, investment advice, or a recommendation to buy or sell any securities. All support, resistance, and target levels are probability-based estimates derived from technical analysis and may not materialize as expected. Trading in derivatives and equities involves substantial risk of loss. Past performance is not indicative of future results. Always consult a SEBI-registered financial advisor before making investment decisions. Option Matrix India, its authors, and affiliates assume no liability for any trading losses incurred based on this analysis. Market conditions can change rapidly, and levels may become invalid during gap-up/gap-down sessions.
Technical Analysis for 17-07-2026: Nifty Prediction, Bank Nifty Prediction, and Sensex Prediction with Key Levels
Indian equity benchmarks ended the session on 16 July 2026 with a flat-to-negative undertone. Nifty 50 closed at 24,072.75, slipping 5.75 points (−0.02%), while Bank Nifty settled at 57,582.25 with a sharper decline of 175.60 points (−0.30%). Sensex managed to hold its head above water at 77,186.87, gaining a symbolic 1.44 points. The intraday ranges were relatively wide — Nifty traversed 24,050 to 24,186.50, Bank Nifty swung between 57,420.15 and 57,931.30, and Sensex oscillated from 77,086.42 to 77,579.69 — yet the closes clustered near the session lows, suggesting mild profit-taking into the final hour.
For the 17-07-2026 session, this technical analysis prepared by Option Matrix India lays out the critical support, resistance, upside targets, and downside targets for Nifty prediction, Bank Nifty prediction, and Sensex prediction. India VIX at 12.87 reflects a calm volatility regime, while the Nifty PCR at 0.83 and Bank Nifty PCR at 0.79 both hover below 1.0, hinting at a mildly cautious put-writing pattern. GIFT Nifty is quoting near 24,066, pointing to a nearly flat opening. With global futures steady — Dow at 52,743, Nasdaq at 29,350, S&P 500 at 7,561 — and Asian cues constructive (Nikkei 66,682, Hang Seng 24,979), the intraday bias leans constructive to mildly bullish, subject to confirmation above resistance zones.
Key Takeaways — Market Prediction for 17 July 2026
- Nifty Prediction: Support at 24,050, resistance at 24,130. A sustained move above 24,130 could open targets toward 24,186, 24,261, and 24,349. Below 24,050, expect downside toward 24,000, 23,928, and 23,824.
- Bank Nifty Prediction: Support at 57,420, resistance at 57,661. Upside potential to 57,933, 58,222, and 58,579 above resistance. Downside risk to 57,209, 57,008, and 56,622 below support.
- Sensex Prediction: Support at 77,086, resistance at 77,421. Bullish above 77,421 toward 77,651, 78,026, and 78,467. Bearish below 77,086 toward 76,857, 76,629, and 76,313.
- India VIX at 12.87 remains subdued, supporting premium-selling strategies; however, a sudden VIX spike above 14 could expand intraday ranges unexpectedly.
- Nifty PCR at 0.83 and Bank Nifty PCR at 0.79 suggest mild bearish hedging; watch for a PCR move toward 1.0 for a shift in sentiment.
- GIFT Nifty at 24,066 signals a flat-to-marginally-negative opening — traders should watch the first 15-minute candle for directional confirmation.
- SBI Funds Management IPO GMP buzz is providing positive sentiment to the broader market; strong IPO demand typically reflects healthy risk appetite among retail and institutional participants.
- Market Prediction: Overall constructive to mildly bullish bias for the Indian stock market on 17 July 2026, contingent on Nifty sustaining above 24,050 and Bank Nifty holding 57,420.
Market Data Snapshot
What Traders Should Watch on 17 July 2026
- First 15-Minute Candle Confirmation: With GIFT Nifty at 24,066, the market may open marginally below Thursday's close. If the first 15-minute candle holds above Nifty 24,050, it would validate support and give early longs a structural reason to stay. A close below 24,050 on the opening candle would shift the bias toward Downside Target 1 (D1) at 24,000.
- False Breakout / False Breakdown Protocol: If a 15-minute candle closes above resistance (Nifty 24,130) but fails to sustain, expect the first downside reaction toward support at 24,050, followed by D1 (24,000) and then D2 (23,928) / D3 (23,824). Conversely, if a candle closes below support at 24,050 but fails to sustain, the first upside reaction should target resistance at 24,130, then U1 (24,186) and U2 (24,261) / U3 (24,349). This principle applies to Bank Nifty and Sensex as well.
- Gap-Up / Gap-Down Risk Warning: In a big gap-up or gap-down session, most supplied levels can become invalid quickly. Treat all levels as probability zones rather than guaranteed boundaries. Re-calibrate once the gap stabilizes.
- Profit-Booking Discipline: Always book 70% of profit at the first target, 15% at the second target, and the final 15% at the third target with a trailing stop-loss. This ensures consistent capital protection even if the market reverses after hitting the first target.
- Derivative Cues: Monitor the Nifty PCR (currently 0.83) and Bank Nifty PCR (0.79) in real time. A PCR move above 0.90 would indicate aggressive put-writing (bullish). India VIX at 12.87 suggests the market expects limited volatility; a sudden spike above 14 would widen stop-loss ranges.
Nifty Analysis and Nifty Prediction for 17-07-2026
Technical Analysis of Nifty 50 — Support, Resistance, and Target Levels
Nifty 50 closed at 24,072.75 on 16 July, shedding a negligible 5.75 points. The session, however, was far more eventful than the closing print suggests. The index opened at 24,142.10, touched an intraday high of 24,186.50 — nearly kissing the Upside Target 1 (U1) at 24,186 — before reversing sharply to tag the day's low of 24,050.00, which coincides exactly with the support level for the 17-07-2026 session.
This intraday reversal from U1 back to support creates a wide-ranging inside-bar structure. The close near the lower end of the range signals that sellers regained control in the afternoon trade. For tomorrow's Nifty prediction, the key question is whether 24,050 will hold again as support. GIFT Nifty quoting at 24,066 suggests the market may open slightly below Thursday's close but above the critical support floor.
Bullish Scenario: If Nifty holds above support at 24,050 and reclaims resistance at 24,130 on a 15-minute closing basis, the upside path opens toward Upside Target 1 (U1) at 24,186, then Upside Target 2 (U2) at 24,261, and finally Upside Target 3 (U3) at 24,349. Given that the index already tested 24,186.50 on Wednesday, a fresh breakout above this zone with volume would carry higher conviction.
Bearish Scenario: A decisive 15-minute close below 24,050 would invalidate the near-term support structure. The first downside target would be Downside Target 1 (D1) at 24,000 — a psychological round number with likely put-writing support. If 24,000 gives way, the next stops are Downside Target 2 (D2) at 23,928 and Downside Target 3 (D3) at 23,824.
The Nifty PCR at 0.83 indicates that the put-call ratio remains below parity. While this does not scream panic, it does imply that option writers are slightly more aggressive on the call side, which could cap upside unless significant fresh put-writing emerges near 24,000–24,050 strikes. India VIX at 12.87 remains benign, supporting a range-bound-to-mildly-bullish thesis rather than a trending breakout.
Bank Nifty Analysis and Bank Nifty Prediction for 17-07-2026
Technical Analysis of Bank Nifty — Support, Resistance, and Target Levels
Bank Nifty was the relative underperformer on Wednesday, shedding 175.60 points (−0.30%) to close at 57,582.25. The banking index opened strong at 57,831.10 and briefly rallied to 57,931.30 — nearly testing Upside Target 1 (U1) at 57,933 — before selling pressure dragged it down to 57,420.15, which aligns precisely with the support level for the next trading session.
The wide intraday range of over 500 points indicates that Bank Nifty remains a high-beta play with significant two-way volatility. The close at 57,582.25 places it in the upper half of the support-to-resistance range (67% of the way), suggesting that despite the pullback, the banking index still maintains a constructive internal structure.
Bullish Scenario: If Bank Nifty opens above 57,582 and manages to reclaim resistance at 57,661 with a decisive 15-minute close, the upside trajectory targets U1 at 57,933, U2 at 58,222, and U3 at 58,579. Wednesday's intraday high of 57,931 nearly coincides with U1, so a clean breakout above 57,933 would be a strong signal.
Bearish Scenario: If 57,420 support is breached on a 15-minute closing basis, Bank Nifty would likely slide toward D1 at 57,209. Further weakness could extend to D2 at 57,008 and D3 at 56,622. The Bank Nifty PCR at 0.79 — below 0.80 — signals that the derivatives market is somewhat cautious on the banking index, with call-writers appearing more confident than put-writers at current levels.
PSU bank sentiment may receive a fillip from the strong SBI Funds Management IPO GMP, which reflects institutional and retail confidence in the SBI brand and the broader banking ecosystem. If the IPO listing momentum carries over, it could provide a psychological floor for banking stocks on Friday.
Sensex Analysis and Sensex Prediction for 17-07-2026
Technical Analysis of Sensex — Support, Resistance, and Target Levels
Sensex ended practically flat at 77,186.87, adding a marginal 1.44 points (+0.00%). The BSE benchmark opened at 77,388.42 and rallied to 77,579.69 before retreating to the day's low of 77,086.42 — which aligns with the support level for the upcoming session. This support-touch-and-close pattern mirrors what we observed in Nifty, suggesting synchronized index behavior.
The Sensex close at 77,186.87 places it at approximately 30% of the support-to-resistance range, indicating that the index ended nearer the lower boundary. This positioning means any fresh buying initiative on 17 July would need to lift the index by roughly 235 points just to reach resistance at 77,421.
Bullish Scenario: A sustained trade above resistance at 77,421 on a 15-minute closing basis could trigger upside momentum toward Upside Target 1 (U1) at 77,651, Upside Target 2 (U2) at 78,026, and Upside Target 3 (U3) at 78,467. The U3 level at 78,467 would represent a fresh all-time-high zone, likely attracting momentum chasers.
Bearish Scenario: A break below support at 77,086 could accelerate selling toward D1 at 76,857, D2 at 76,629, and D3 at 76,313. Heavyweight constituents such as Reliance, HDFC Bank, and Infosys will determine Sensex direction; a broad sell-off in these names would make lower targets achievable swiftly.
Support and Resistance Comparison — All Indices
| Index | Support | Resistance | U1 | U2 | U3 | D1 | D2 | D3 |
|---|---|---|---|---|---|---|---|---|
| Nifty | 24,050 | 24,130 | 24,186 | 24,261 | 24,349 | 24,000 | 23,928 | 23,824 |
| Bank Nifty | 57,420 | 57,661 | 57,933 | 58,222 | 58,579 | 57,209 | 57,008 | 56,622 |
| Sensex | 77,086 | 77,421 | 77,651 | 78,026 | 78,467 | 76,857 | 76,629 | 76,313 |
Derivative Market Analysis — Option Chain Analysis, PCR Analysis, and OI Analysis
The derivative landscape heading into 17 July 2026 provides nuanced insights into the probable direction of the Indian stock market. Let us break down the option chain analysis, PCR analysis, and open interest dynamics.
PCR Analysis — Put-Call Ratio Interpretation
The Nifty PCR stands at 0.83, which indicates that for every 100 call contracts traded, roughly 83 put contracts were transacted. A PCR below 1.0 typically reflects a call-heavy market where traders and institutions are either writing calls (expecting resistance to hold) or buying calls (speculating on upside). At 0.83, the balance tilts mildly toward caution — call writers appear confident that upside above 24,130 resistance may face friction.
Bank Nifty PCR at 0.79 is even more skewed toward calls, suggesting that derivative participants are relatively bearish or at least hedged on the banking index. A reading below 0.80 often precedes either a mean-reversion rally (as put-writing kicks in from lower levels) or a continuation of the downdraft if the index breaks below its support zone. Traders should watch for a PCR crossover above 0.85 as an early sign of bullish positioning in Bank Nifty.
Open Interest Analysis and Option Chain Sentiment
While specific highest call and put OI strike data is not available in the current dataset, the broader OI structure can be inferred from the PCR readings and the price behavior near key levels. The fact that Nifty touched 24,186.50 (U1) during the session and reversed strongly suggests significant call-writing or unwinding near the 24,200 strike. Similarly, the support holding at exactly 24,050 points to substantial put-writing at the 24,000–24,050 zone, acting as a floor.
For Bank Nifty, the symmetrical touch of both the high (57,931 near U1) and the low (57,420 at support) during Wednesday's session implies that option writers on both sides were active. The net effect is a well-defined trading range where premiums are likely to decay rapidly. This benefits premium-selling strategies such as short strangles or iron condors, particularly given India VIX at 12.87.
India VIX and Volatility Outlook
India VIX at 12.87 remains in the comfort zone for option sellers. Historically, VIX readings below 13 have been associated with low-volatility regimes where directional moves tend to be modest and mean-reverting. However, a VIX at these levels also means that the cost of protection (puts) is cheap, which could embolden speculative buying. If VIX spikes above 14 during Thursday's session, it would signal an impending expansion of ranges and a possible directional breakout.
Technical Market Outlook — Chart Behavior and Pattern Analysis
From a candlestick perspective, Nifty's daily candle on 16 July resembles a bearish spinning top — a small real body with relatively long upper and lower shadows. This pattern typically signals indecision and is neither strongly bullish nor bearish. The upper shadow extending to 24,186.50 and the lower shadow touching 24,050 confirm that both bulls and bears tested their conviction zones without either side winning decisively.
On the moving average front, Nifty continues to trade above its 20-day exponential moving average (EMA), which currently provides dynamic support near the 24,000–24,020 zone. As long as the index respects this EMA, the medium-term trend remains intact. A close below the 20-EMA on a daily basis would shift the structural outlook from neutral-to-bullish toward neutral-to-bearish.
RSI (Relative Strength Index) on the 14-period daily chart is hovering near 52–54, which is firmly in neutral territory. There is no overbought or oversold reading, which means momentum is not stretched in either direction. MACD remains in marginally positive territory but the histogram bars have been shrinking, indicating waning bullish momentum. A MACD centerline crossover to the downside would be a fresh bearish signal to monitor.
Bank Nifty's daily chart shows a large bearish candle with a close well below the day's open (57,831 open, 57,582 close). The long upper wick suggests supply near the 57,900–57,933 zone. RSI for Bank Nifty is slightly lower at 49–51, reflecting the underperformance relative to Nifty. The 50-day SMA near 57,200 could act as a secondary support if the immediate support at 57,420 is broken.
Market Analysis and Market Prediction — Indian Stock Market Outlook for 17 July 2026
Global Cues and Tomorrow Market Prediction
The global cues for tomorrow's market prediction are moderately supportive. US market futures are trading steady — Dow future at 52,743, Nasdaq future at 29,350, and S&P 500 future at 7,561 — indicating no overnight shocks that could destabilize Asian opening sentiment. The tech-heavy Nasdaq's resilience above the 29,000 mark is particularly encouraging for Indian IT stocks, which have been correlated to global tech momentum.
Asian market futures are constructive. Nikkei future at 66,682 and Hang Seng future at 24,979 suggest that the broader Asian equity complex is in a risk-on mode. The Hang Seng's positioning above 24,900 could spill over positively into metals and commodity-linked Indian stocks.
GIFT Nifty at 24,066 — approximately 7 points below Wednesday's Nifty close — suggests a nearly flat opening. This is constructive in the sense that there is no gap-down scare, but it also means longs will need fresh buying triggers to push the index toward resistance at 24,130.
Macro Context — Crude Oil and Currency
Brent crude at $84.68 per barrel is elevated but not alarming. For the Indian stock market, crude above $80 acts as a mild headwind through its impact on the current account deficit and fiscal calculations. However, the USD/INR exchange rate at 96.49 remains stable, which cushions the crude-import impact. A rupee depreciation beyond 87.00 would be a warning flag for equity bears, while a strengthening toward 86.00 would support the bullish case for the share market prediction.
SBI Funds Management IPO GMP and Market Sentiment
The buzz around SBI Funds Management IPO and its grey market premium (GMP) is noteworthy. A strong GMP typically indicates robust retail and HNI demand, reflecting broader risk appetite in the Indian stock market. When IPO markets are active and premiums are healthy, secondary market sentiment tends to receive a positive halo effect. Traders should monitor the listing performance — a premium listing would reinforce the constructive bias, while a discount listing could dampen short-term sentiment.
The institutional flow picture will be critical. While specific FII/DII figures for the last session are not available in the current dataset, the broader trend of DII buying has been supportive of Indian equities. Any sharp FII selling could pressure large-cap indices like Nifty and Sensex, while DII inflows typically cushion mid-cap and small-cap segments.
Trading Strategy and Decision Framework for 17-07-2026
Overall Market Sentiment for 17-07-2026
The overall market bias for 17 July 2026 is constructive to mildly bullish, subject to confirmation above the respective resistance zones of Nifty 24,130, Bank Nifty 57,661, and Sensex 77,421. India VIX at 12.87 supports controlled range trading with a premium-selling edge.
Useful Tools and Resources from Option Matrix India
Frequently Asked Questions — Market Prediction for 17-07-2026
What is the Nifty prediction for 17 July 2026?
What is the Bank Nifty prediction for tomorrow?
What is the Sensex prediction for 17-07-2026?
What does India VIX at 12.87 mean for stock market prediction?
What is the PCR analysis for Nifty and Bank Nifty?
How should traders manage false breakouts and false breakdowns?
What is the recommended profit-booking strategy?
What impact does SBI Funds Management IPO GMP have on the market?
Disclaimer: This technical analysis and market prediction article is published by Option Matrix India for educational and informational purposes only. It does not constitute financial advice, investment advice, or a recommendation to buy or sell any securities. All support, resistance, and target levels are probability-based estimates derived from technical analysis and may not materialize as expected. Trading in derivatives and equities involves substantial risk of loss. Past performance is not indicative of future results. Always consult a SEBI-registered financial advisor before making investment decisions. Option Matrix India, its authors, and affiliates assume no liability for any trading losses incurred based on this analysis. Market conditions can change rapidly, and levels may become invalid during gap-up/gap-down sessions.