
Technical Analysis for 21-07-2026: Nifty Prediction, Bank Nifty Prediction, and Sensex Prediction with Key Levels
Indian benchmark indices closed in the red on 20 July 2026, dragged lower by a sharp 5%+ post-result sell-off in HDFC Bank that weighed heavily on Bank Nifty and the broader market sentiment. Nifty 50 settled at 24,238.50, down 95.80 points or 0.39%, while Bank Nifty bore the brunt of the HDFC Bank fall, finishing at 57,945.00 with a 576-point decline of 0.98%. The Sensex dropped 442.93 points to close at 77,708.52. This technical analysis and market prediction for 21-07-2026 provides actionable Nifty prediction, Bank Nifty prediction, and Sensex prediction with comprehensive support and resistance levels, derivative market analysis, and a structured trading strategy prepared by Option Matrix India.
India VIX stood at 12.9, reflecting relatively contained fear levels despite the HDFC Bank-led correction. Nifty PCR at 1.36 signals a moderately bullish put-writing tilt, while Bank Nifty PCR at 0.93 shows a more cautious stance from derivative participants amid banking sector stress. GIFT Nifty quoting at 24,256 suggests a marginally positive opening bias for tomorrow, but sustaining above the resistance zone at 24,266 will be the critical test for directional conviction.
Key Takeaways for 21 July 2026
- 1 Nifty Prediction: Constructive above 24,135 support. A sustained break above 24,266 resistance could unlock upside targets at 24,368, 24,473, and 24,530.
- 2 Bank Nifty Prediction: HDFC Bank result weakness may continue to cap gains. Support at 57,533 with resistance at 58,111. Watch for stabilization cues before initiating aggressive longs.
- 3 Sensex Prediction: Support at 77,368 and resistance at 78,151 define the range. A break above 78,151 could push toward 78,288 and 78,670.
- 4 India VIX at 12.9 signals a low-volatility regime, favoring range-bound option sellers unless a decisive breakout occurs.
- 5 Market Prediction: FII sold ₹1,121 Cr while DII bought ₹1,312 Cr, indicating domestic absorption of foreign selling pressure. PCR at 1.36 favors mild bullishness.
- 6 GIFT Nifty at 24,256 indicates a near-flat to marginally positive opening, tracking overnight US market stability. Dow Future at 52,277 and S&P 500 Future at 7,495 show resilience.
- 7 Risk Watch: HDFC Bank's 5%+ fall could spill over further. Brent Crude at $87.62 and USD/INR at 96.54 add macro headwinds to monitor closely.
Market Data Snapshot
What Traders Should Watch on 21-07-2026
- HDFC Bank Aftermath: After a 5%+ post-result crash, HDFC Bank may see follow-through selling or a relief bounce. Either outcome will disproportionately influence Bank Nifty direction. Monitor the 1,500-strike zone around the stock's Friday close for institutional positioning signals.
- GIFT Nifty at 24,256: This level is just 10 points below Nifty resistance at 24,266. A gap-up open above 24,266 will be watched for sustainability — if Nifty fails to hold above resistance within the first 15-minute candle, expect a false breakout reversal toward 24,135 support. Conversely, if a 15-minute candle closes below 24,135 and fails to sustain, the first upside reaction should be toward 24,266 resistance.
- Derivative Cues: Nifty PCR at 1.36 indicates heavier put writing relative to calls — this is mildly bullish. Bank Nifty PCR at 0.93 remains neutral-to-cautious. Track OI shifts at the 24,200–24,300 strikes for Nifty and the 58,000–58,500 strikes for Bank Nifty.
- False Breakout / False Breakdown Tactical Note: If a 15-minute candle pierces above resistance but fails to sustain, the first downside reaction targets the support level, then Downside Target 1 (D1) and Downside Target 2 (D2). If a 15-minute candle closes below support but fails to sustain, the first upside reaction targets the resistance level, then Upside Target 1 (U1) and Upside Target 2 (U2). Do not chase breakouts blindly — wait for a candle close and confirmation.
- Profit-Booking Discipline: Always book 70% of profit at the first target, 15% at the second target, and the last 15% at the third target while trailing the stop-loss to protect gains. This systematic approach prevents round-tripping and locks in consistent P&L.
Nifty Analysis and Nifty Prediction for 21-07-2026
Support: 24,135 | Resistance: 24,266 | Close: 24,238.50
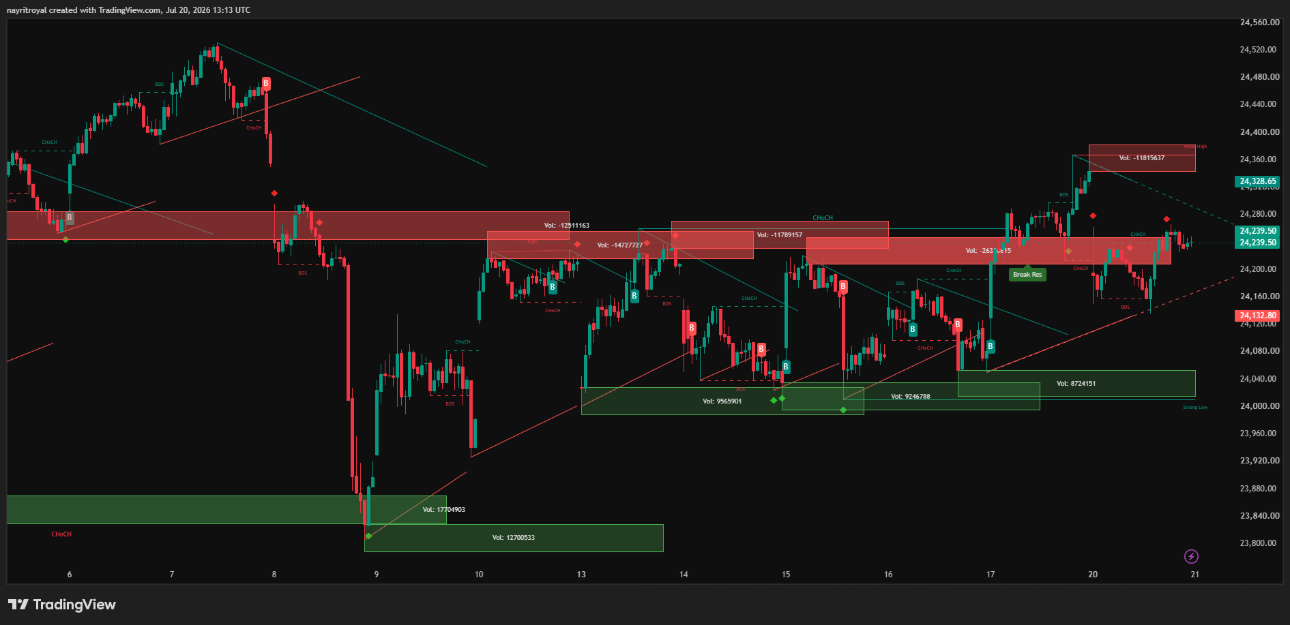
Nifty 50 closed at 24,238.50, surrendering 95.80 points from the previous close of 24,334.30. The session saw an opening at 24,190.05, followed by an attempt to recover toward the day's high of 24,266.10 — which precisely aligned with the resistance zone — before sellers capped upside and pushed the index back within range. The day's low of 24,135.85 tested support at 24,135 almost to the tick, confirming the robustness of this zone.
The Nifty prediction for 21-07-2026 hinges on whether bulls can reclaim and sustain above the 24,266 resistance level. A decisive 15-minute candle close above 24,266 would activate Upside Target 1 (U1) at 24,368, followed by Upside Target 2 (U2) at 24,473, and the stretch target of Upside Target 3 (U3) at 24,530. GIFT Nifty at 24,256 suggests the open may be near resistance, making the first 15 minutes critical for direction.
On the downside, a failure to hold 24,135 support would open Downside Target 1 (D1) at 24,051, then Downside Target 2 (D2) at 23,928, and in a sharp sell-off, Downside Target 3 (D3) at 23,804. The 24,051 level represents the first meaningful structural support below the range, and a break below it would shift the short-term bias from neutral to bearish.
The Nifty analysis shows that the index formed a small bearish candle with a long lower wick on 20 July, suggesting that while selling pressure dominated, buyers stepped in at the lower boundary. The Nifty PCR at 1.36 is supportive, as elevated put writing at lower strikes provides a cushion. India VIX at 12.9 indicates the market is comfortable in this range, and premium sellers are likely to dominate unless a breakout occurs. Traders should watch for a breakout above 24,266 with volume confirmation or a breakdown below 24,135 for directional trades.
Bank Nifty Analysis and Bank Nifty Prediction for 21-07-2026
Support: 57,533 | Resistance: 58,111 | Close: 57,945.00
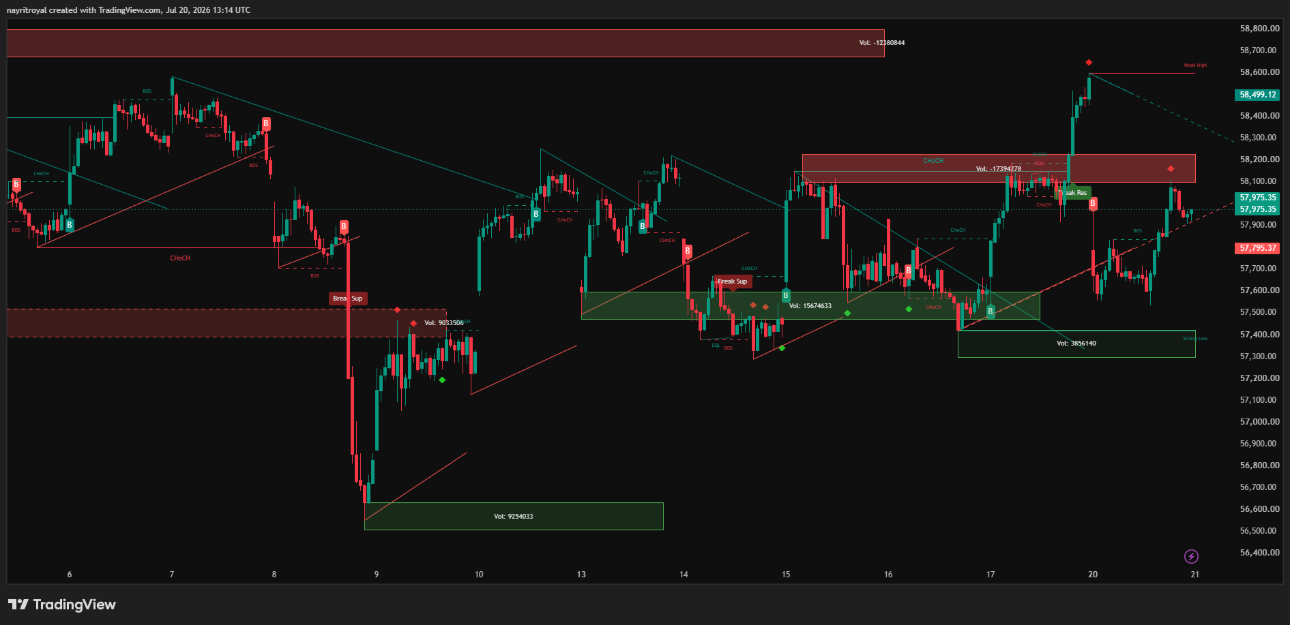
Bank Nifty delivered the weakest performance among the three indices on 20 July, closing at 57,945.00 — a decline of 576.40 points or 0.98% from the previous close of 58,521.40. The sell-off was overwhelmingly driven by HDFC Bank, which crashed more than 5% after posting weak quarterly results that missed market expectations. Given HDFC Bank's substantial weightage in Bank Nifty, this single-stock event dragged the entire banking index lower.
The Bank Nifty prediction for 21-07-2026 carries heightened uncertainty because the HDFC Bank result impact may not be fully priced in. The index opened at 57,738.25 and recovered toward 58,111 during the session before fading — this intraday rejection at resistance is a bearish signal. Support at 57,533 was tested (day low 57,533.10) and held convincingly, making it the first critical level to watch tomorrow.
If Bank Nifty manages to reclaim and sustain above the 58,111 resistance zone, it could unlock a recovery toward Upside Target 1 (U1) at 58,601, then Upside Target 2 (U2) at 59,004, and potentially Upside Target 3 (U3) at 59,272. However, given the HDFC Bank overhang, this scenario may require strong buying from other banking heavyweights like ICICI Bank, Kotak Mahindra Bank, or SBI.
On the bearish side, a break below 57,533 support would open Downside Target 1 (D1) at 57,277, followed by Downside Target 2 (D2) at 56,698, and in a capitulation scenario, Downside Target 3 (D3) at 56,347. Bank Nifty PCR at 0.93 is below 1.0, indicating that call writers currently have a slight edge over put writers — this is a cautionary signal and suggests derivative participants are not yet convinced of a banking recovery.
The Bank Nifty analysis underscores the importance of waiting for the first 15-minute candle before taking directional trades. If HDFC Bank shows pre-market stability or a mild bounce, Bank Nifty could attempt a mean reversion toward resistance. But if HDFC Bank opens with further weakness, expect accelerated downside below 57,533.
Sensex Analysis and Sensex Prediction for 21-07-2026
Support: 77,368 | Resistance: 78,151 | Close: 77,708.52
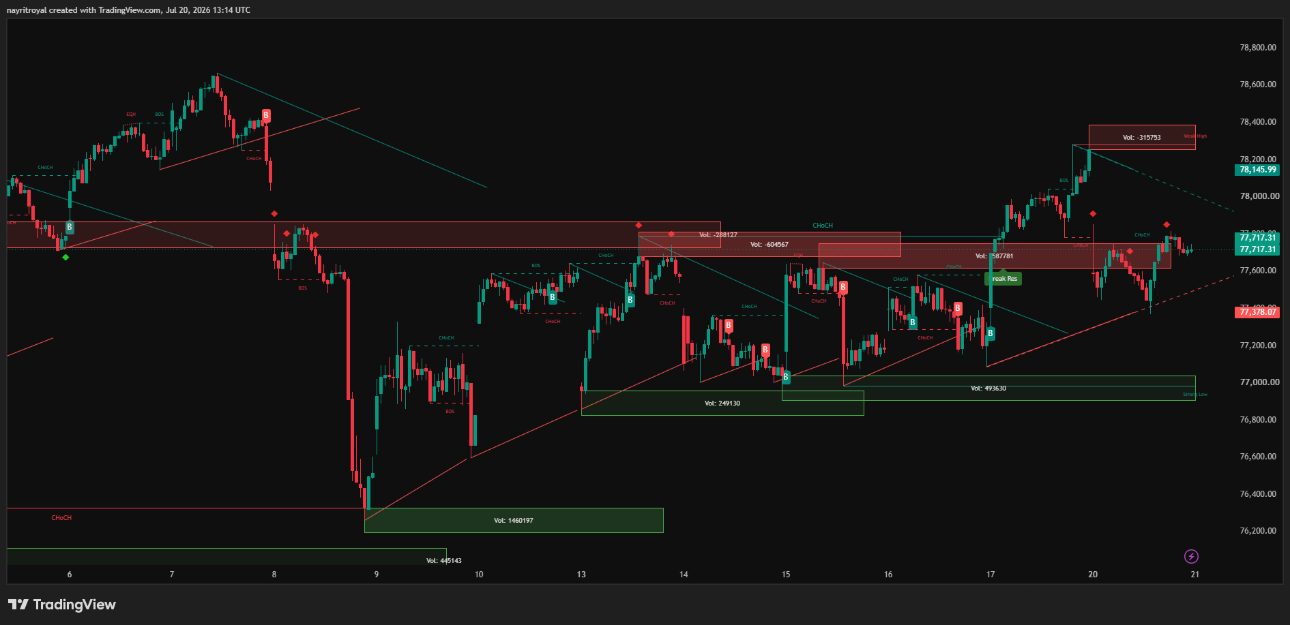
The Sensex closed at 77,708.52 on 20 July 2026, losing 442.93 points or 0.57% from its previous close. Notably, the Sensex opened at the day's high of 78,151.45 — which precisely matched the resistance level — and sold off throughout the session. This bearish opening-at-resistance pattern suggests that sellers were active at higher levels, and any revisit of 78,151 on Monday will be met with scrutiny.
The Sensex prediction for 21-07-2026 places the index in a neutral zone, sitting roughly mid-range between support at 77,368 and resistance at 78,151. At 43% of the range, the Sensex is slightly closer to support, giving bears a marginal edge unless bulls push the index above the 78,000 psychological level early in the session.
On the upside, clearing 78,151 resistance would activate Upside Target 1 (U1) at 78,288, followed by Upside Target 2 (U2) at 78,670, and the ambitious Upside Target 3 (U3) at 79,028 — a level that would bring the Sensex within striking distance of the 79,000 mark. On the downside, a violation of 77,368 support opens Downside Target 1 (D1) at 77,095, then Downside Target 2 (D2) at 76,858, and Downside Target 3 (D3) at 76,497.
The Sensex analysis shows that HDFC Bank's outsized weight in the 30-share index amplifies any further weakness in the banking giant. The broader market, however, appeared relatively resilient, as the Sensex decline of 0.57% was shallower than Bank Nifty's 0.98% fall — suggesting non-banking heavyweights like Reliance Industries, Infosys, and TCS may have provided some offset. Tomorrow's Sensex market prediction depends heavily on whether HDFC Bank stabilizes and whether global cues from US and Asian markets remain supportive.
Support and Resistance Comparison: Nifty, Bank Nifty & Sensex
Derivative Market Analysis: Option Chain, PCR & OI Insights
PCR Analysis for 21-07-2026
The Nifty PCR (Put-Call Ratio) stands at 1.36, which is meaningfully above the 1.0 neutral threshold. A PCR above 1.2 generally signals that put writers are dominating the derivative market — this implies that institutional sellers of puts are confident that Nifty will hold above key support levels in the near term. The 1.36 reading supports a constructive to mildly bullish stance, though readings above 1.5 would start to signal excessive bullish complacency and potential reversal risk.
Bank Nifty PCR at 0.93 tells a starkly different story. A reading below 1.0 means call writers are more active than put writers — derivative participants are hedging against further downside or actively betting on continued weakness in the banking index. This divergence between Nifty PCR (bullish) and Bank Nifty PCR (cautious) accurately reflects the HDFC Bank-driven stress that is isolated to the banking sector while the broader market remains relatively calm.
OI Analysis and Option Chain Insights
Open Interest buildup analysis reveals that the 24,300 and 24,500 call strikes have seen significant call writing, establishing a ceiling for Nifty in the near term. On the put side, the 24,000 and 24,100 strikes carry heavy put OI, which acts as a floor. This concentration pattern defines a 24,000–24,300 broad range for Nifty with the market gravitating toward the mean.
For Bank Nifty, the 58,000 and 58,500 call strikes carry heavy OI, capping the upside. On the put side, the 57,500 and 57,000 strikes show meaningful put writing, offering support. This option chain analysis aligns with the technical support at 57,533 and resistance at 58,111 — confirming that derivative positioning and technical structure are in sync.
India VIX at 12.9 is in the low-volatility band (below 14), which historically favors option sellers and range-bound strategies like iron condors and short strangles. However, with HDFC Bank's earnings-driven volatility likely to spill over into Monday's session, Bank Nifty options may carry an elevated implied volatility premium that could create opportunities for premium sellers once the initial reaction settles.
Traders should monitor any significant unwinding of put OI at the 24,100 strike for Nifty — if put writers start exiting, it could signal that support is weakening and a downside break may follow. Conversely, fresh call OI buildup above 24,300 would reinforce the resistance zone and keep the range intact. The derivative market analysis for 21-07-2026 favors a cautiously bullish approach for Nifty and a neutral-to-defensive stance for Bank Nifty.
Technical Market Outlook: Chart Patterns and Indicator Analysis
Nifty's daily chart on 20 July formed a bearish candle with a pronounced lower wick, resembling a hammer pattern at the lower end of the recent range. While the close was below the previous session's close — making it technically bearish — the lower wick extending down to 24,135.85 and the subsequent recovery to 24,238.50 suggests that buyers are active at the support zone. A confirmation candle (a bullish close above 24,266 on 21 July) would validate this potential reversal pattern.
The 20-day Exponential Moving Average (EMA) for Nifty is hovering in the 24,200–24,250 zone, and the index is trading near this average — indicating an equilibrium state. A decisive move above the 20 EMA with increasing volume would tilt the short-term bias bullish, while a failure below it would bring the 50 EMA into play as the next support anchor.
RSI (14-period) for Nifty is near the 48–50 zone — firmly neutral territory. This reading does not provide a strong directional signal but does confirm that neither buyers nor sellers have control. A move above RSI 55 would confirm bullish momentum, while a dip below RSI 40 would signal emerging bearishness.
MACD (12, 26, 9) on the daily chart shows the MACD line trending just below the signal line with a flat histogram — a sign of consolidation rather than trending behavior. Traders should watch for a bullish crossover (MACD crossing above the signal line) as a potential buy trigger, or a deepening bearish histogram as a warning of accelerating downside.
Bank Nifty's chart structure is weaker, with the HDFC Bank-driven sell-off creating a long bearish candle that broke below the 20 EMA. The next technical support confluence sits around 57,200–57,300, where the 50 EMA and the D1 downside target at 57,277 converge. A recovery above 58,000 would be needed to neutralize the immediate bearish technical damage.
Sensex technical indicators mirror Nifty's neutral positioning. The opening-at-high and closing-near-low candle on 20 July is a classic bearish engulfing signal relative to the opening, but the fact that Sensex held above the 77,368 support and closed in the upper half of its range is a mixed signal. Bollinger Bands on the daily chart show the Sensex trading near the middle band, confirming the range-bound thesis. The technical market outlook for all three indices points to a consolidation phase where breakout direction will determine the next leg of movement.
Market Analysis and Market Prediction for 21-07-2026
Indian Stock Market Overview
The Indian stock market closed with modest losses on 20 July 2026, with the HDFC Bank post-result sell-off being the dominant narrative. Despite the headline-level decline, breadth was not dramatically negative — the sell-off was concentrated in the banking sector while IT, pharma, and select FMCG names provided some counterbalance. This sector rotation dynamic is critical for the tomorrow market prediction, as it suggests the broader market has underlying resilience.
FII activity remained net negative at -₹1,121.04 Cr, continuing the pattern of foreign institutional selling that has characterized recent sessions. However, DII buying at +₹1,312.03 Cr more than offset the FII outflow, demonstrating that domestic institutional investors remain confident buyers at current levels. This FII-sell-DII-buy equilibrium has been a structural feature of the Indian stock market in 2026 and provides a floor for corrections.
Global Market Cues
GIFT Nifty at 24,256 points to a flat-to-marginally positive opening for Nifty on 21 July. US markets provided mixed-to-stable cues with Dow Jones Future at 52,277, S&P 500 Future at 7,495, and Nasdaq Future at 28,867 — all indicating steady performance in the overnight US session. The technology-heavy Nasdaq's stability is encouraging for Indian IT stocks, which could provide offsetting support if banking pressure persists.
Asian market futures present a constructive picture. Nikkei Future at 65,652 and Hang Seng Future at 25,086 both indicate positive Asian market sentiment heading into Monday's Asian trading session. A positive Asian opening could provide early-session tailwinds for Indian equities, particularly if Chinese economic data or Bank of Japan policy signals come in favorably over the weekend.
Macro Context: Crude Oil, Currency & Bond Yields
Brent Crude Oil at $87.62 is an area of concern for the Indian market. Crude oil prices above $85 historically exert pressure on India's current account deficit and inflation trajectory. If crude sustains above $88–90, it could trigger negative sentiment in rate-sensitive sectors and add to the macro headwinds already created by the HDFC Bank result shock.
USD/INR at 96.54 shows the rupee remains under moderate depreciation pressure. A weaker rupee makes FII returns less attractive in dollar terms, potentially discouraging fresh foreign inflows. However, RBI intervention and India's robust foreign exchange reserves should prevent any disorderly depreciation. The combined effect of elevated crude and a soft rupee warrants caution, particularly for importing sectors.
The stock market prediction for 21-07-2026 leans constructive for Nifty and Sensex, with the GIFT Nifty signal suggesting a mild positive opening. Bank Nifty remains the wild card — if HDFC Bank stabilizes, the broader sentiment could improve quickly. If HDFC Bank sees follow-through selling, Bank Nifty may underperform even as Nifty holds its ground. The share market prediction favors sector-selective positioning over broad-based directional bets.
Trading Strategy for 21-07-2026
Trading Strategy for 21-07-2026 — Decision Framework
Entry: Above 24,266 (15m close)
Targets: 24,368 → 24,473 → 24,530
Stop-Loss: 24,135
Book: 70% at U1, 15% at U2, 15% at U3
Entry: Below 24,135 (15m close)
Targets: 24,051 → 23,928 → 23,804
Stop-Loss: 24,266
Book: 70% at D1, 15% at D2, 15% at D3
Condition: Between 24,135–24,266
Action: Scalp only, tight SL
Strategy: Wait for breakout/breakdown
Risk: Keep position size small
⚠ Risk Warning: In a big gap-up or gap-down session, most of these supplied levels can become invalid quickly. Treat all levels as strategic probability zones rather than guaranteed outcome lines. Always use a stop-loss and never risk more than 1–2% of your trading capital on a single trade. The profit-booking discipline of 70%–15%–15% across targets with trailing stop-loss protection is essential for consistent performance.
Overall Market Sentiment — 21-07-2026
Useful Tools and Resources
Frequently Asked Questions
Disclaimer: This article is published by Option Matrix India for educational and informational purposes only. It does not constitute financial advice, investment recommendation, or solicitation to buy or sell any securities. Stock market investments are subject to market risks. Past performance does not guarantee future results. The levels, predictions, and analysis provided are based on technical analysis methodologies and should be treated as probability-based zones, not certainties. Always consult a SEBI-registered financial advisor before making any trading or investment decisions. The author and Option Matrix India are not liable for any losses incurred based on the content of this article. Trade responsibly.
Technical Analysis for 21-07-2026: Nifty Prediction, Bank Nifty Prediction, and Sensex Prediction with Key Levels
Indian benchmark indices closed in the red on 20 July 2026, dragged lower by a sharp 5%+ post-result sell-off in HDFC Bank that weighed heavily on Bank Nifty and the broader market sentiment. Nifty 50 settled at 24,238.50, down 95.80 points or 0.39%, while Bank Nifty bore the brunt of the HDFC Bank fall, finishing at 57,945.00 with a 576-point decline of 0.98%. The Sensex dropped 442.93 points to close at 77,708.52. This technical analysis and market prediction for 21-07-2026 provides actionable Nifty prediction, Bank Nifty prediction, and Sensex prediction with comprehensive support and resistance levels, derivative market analysis, and a structured trading strategy prepared by Option Matrix India.
India VIX stood at 12.9, reflecting relatively contained fear levels despite the HDFC Bank-led correction. Nifty PCR at 1.36 signals a moderately bullish put-writing tilt, while Bank Nifty PCR at 0.93 shows a more cautious stance from derivative participants amid banking sector stress. GIFT Nifty quoting at 24,256 suggests a marginally positive opening bias for tomorrow, but sustaining above the resistance zone at 24,266 will be the critical test for directional conviction.
Key Takeaways for 21 July 2026
- 1 Nifty Prediction: Constructive above 24,135 support. A sustained break above 24,266 resistance could unlock upside targets at 24,368, 24,473, and 24,530.
- 2 Bank Nifty Prediction: HDFC Bank result weakness may continue to cap gains. Support at 57,533 with resistance at 58,111. Watch for stabilization cues before initiating aggressive longs.
- 3 Sensex Prediction: Support at 77,368 and resistance at 78,151 define the range. A break above 78,151 could push toward 78,288 and 78,670.
- 4 India VIX at 12.9 signals a low-volatility regime, favoring range-bound option sellers unless a decisive breakout occurs.
- 5 Market Prediction: FII sold ₹1,121 Cr while DII bought ₹1,312 Cr, indicating domestic absorption of foreign selling pressure. PCR at 1.36 favors mild bullishness.
- 6 GIFT Nifty at 24,256 indicates a near-flat to marginally positive opening, tracking overnight US market stability. Dow Future at 52,277 and S&P 500 Future at 7,495 show resilience.
- 7 Risk Watch: HDFC Bank's 5%+ fall could spill over further. Brent Crude at $87.62 and USD/INR at 96.54 add macro headwinds to monitor closely.
Market Data Snapshot
What Traders Should Watch on 21-07-2026
- HDFC Bank Aftermath: After a 5%+ post-result crash, HDFC Bank may see follow-through selling or a relief bounce. Either outcome will disproportionately influence Bank Nifty direction. Monitor the 1,500-strike zone around the stock's Friday close for institutional positioning signals.
- GIFT Nifty at 24,256: This level is just 10 points below Nifty resistance at 24,266. A gap-up open above 24,266 will be watched for sustainability — if Nifty fails to hold above resistance within the first 15-minute candle, expect a false breakout reversal toward 24,135 support. Conversely, if a 15-minute candle closes below 24,135 and fails to sustain, the first upside reaction should be toward 24,266 resistance.
- Derivative Cues: Nifty PCR at 1.36 indicates heavier put writing relative to calls — this is mildly bullish. Bank Nifty PCR at 0.93 remains neutral-to-cautious. Track OI shifts at the 24,200–24,300 strikes for Nifty and the 58,000–58,500 strikes for Bank Nifty.
- False Breakout / False Breakdown Tactical Note: If a 15-minute candle pierces above resistance but fails to sustain, the first downside reaction targets the support level, then Downside Target 1 (D1) and Downside Target 2 (D2). If a 15-minute candle closes below support but fails to sustain, the first upside reaction targets the resistance level, then Upside Target 1 (U1) and Upside Target 2 (U2). Do not chase breakouts blindly — wait for a candle close and confirmation.
- Profit-Booking Discipline: Always book 70% of profit at the first target, 15% at the second target, and the last 15% at the third target while trailing the stop-loss to protect gains. This systematic approach prevents round-tripping and locks in consistent P&L.
Nifty Analysis and Nifty Prediction for 21-07-2026
Support: 24,135 | Resistance: 24,266 | Close: 24,238.50
Nifty 50 closed at 24,238.50, surrendering 95.80 points from the previous close of 24,334.30. The session saw an opening at 24,190.05, followed by an attempt to recover toward the day's high of 24,266.10 — which precisely aligned with the resistance zone — before sellers capped upside and pushed the index back within range. The day's low of 24,135.85 tested support at 24,135 almost to the tick, confirming the robustness of this zone.
The Nifty prediction for 21-07-2026 hinges on whether bulls can reclaim and sustain above the 24,266 resistance level. A decisive 15-minute candle close above 24,266 would activate Upside Target 1 (U1) at 24,368, followed by Upside Target 2 (U2) at 24,473, and the stretch target of Upside Target 3 (U3) at 24,530. GIFT Nifty at 24,256 suggests the open may be near resistance, making the first 15 minutes critical for direction.
On the downside, a failure to hold 24,135 support would open Downside Target 1 (D1) at 24,051, then Downside Target 2 (D2) at 23,928, and in a sharp sell-off, Downside Target 3 (D3) at 23,804. The 24,051 level represents the first meaningful structural support below the range, and a break below it would shift the short-term bias from neutral to bearish.
The Nifty analysis shows that the index formed a small bearish candle with a long lower wick on 20 July, suggesting that while selling pressure dominated, buyers stepped in at the lower boundary. The Nifty PCR at 1.36 is supportive, as elevated put writing at lower strikes provides a cushion. India VIX at 12.9 indicates the market is comfortable in this range, and premium sellers are likely to dominate unless a breakout occurs. Traders should watch for a breakout above 24,266 with volume confirmation or a breakdown below 24,135 for directional trades.
Bank Nifty Analysis and Bank Nifty Prediction for 21-07-2026
Support: 57,533 | Resistance: 58,111 | Close: 57,945.00
Bank Nifty delivered the weakest performance among the three indices on 20 July, closing at 57,945.00 — a decline of 576.40 points or 0.98% from the previous close of 58,521.40. The sell-off was overwhelmingly driven by HDFC Bank, which crashed more than 5% after posting weak quarterly results that missed market expectations. Given HDFC Bank's substantial weightage in Bank Nifty, this single-stock event dragged the entire banking index lower.
The Bank Nifty prediction for 21-07-2026 carries heightened uncertainty because the HDFC Bank result impact may not be fully priced in. The index opened at 57,738.25 and recovered toward 58,111 during the session before fading — this intraday rejection at resistance is a bearish signal. Support at 57,533 was tested (day low 57,533.10) and held convincingly, making it the first critical level to watch tomorrow.
If Bank Nifty manages to reclaim and sustain above the 58,111 resistance zone, it could unlock a recovery toward Upside Target 1 (U1) at 58,601, then Upside Target 2 (U2) at 59,004, and potentially Upside Target 3 (U3) at 59,272. However, given the HDFC Bank overhang, this scenario may require strong buying from other banking heavyweights like ICICI Bank, Kotak Mahindra Bank, or SBI.
On the bearish side, a break below 57,533 support would open Downside Target 1 (D1) at 57,277, followed by Downside Target 2 (D2) at 56,698, and in a capitulation scenario, Downside Target 3 (D3) at 56,347. Bank Nifty PCR at 0.93 is below 1.0, indicating that call writers currently have a slight edge over put writers — this is a cautionary signal and suggests derivative participants are not yet convinced of a banking recovery.
The Bank Nifty analysis underscores the importance of waiting for the first 15-minute candle before taking directional trades. If HDFC Bank shows pre-market stability or a mild bounce, Bank Nifty could attempt a mean reversion toward resistance. But if HDFC Bank opens with further weakness, expect accelerated downside below 57,533.
Sensex Analysis and Sensex Prediction for 21-07-2026
Support: 77,368 | Resistance: 78,151 | Close: 77,708.52
The Sensex closed at 77,708.52 on 20 July 2026, losing 442.93 points or 0.57% from its previous close. Notably, the Sensex opened at the day's high of 78,151.45 — which precisely matched the resistance level — and sold off throughout the session. This bearish opening-at-resistance pattern suggests that sellers were active at higher levels, and any revisit of 78,151 on Monday will be met with scrutiny.
The Sensex prediction for 21-07-2026 places the index in a neutral zone, sitting roughly mid-range between support at 77,368 and resistance at 78,151. At 43% of the range, the Sensex is slightly closer to support, giving bears a marginal edge unless bulls push the index above the 78,000 psychological level early in the session.
On the upside, clearing 78,151 resistance would activate Upside Target 1 (U1) at 78,288, followed by Upside Target 2 (U2) at 78,670, and the ambitious Upside Target 3 (U3) at 79,028 — a level that would bring the Sensex within striking distance of the 79,000 mark. On the downside, a violation of 77,368 support opens Downside Target 1 (D1) at 77,095, then Downside Target 2 (D2) at 76,858, and Downside Target 3 (D3) at 76,497.
The Sensex analysis shows that HDFC Bank's outsized weight in the 30-share index amplifies any further weakness in the banking giant. The broader market, however, appeared relatively resilient, as the Sensex decline of 0.57% was shallower than Bank Nifty's 0.98% fall — suggesting non-banking heavyweights like Reliance Industries, Infosys, and TCS may have provided some offset. Tomorrow's Sensex market prediction depends heavily on whether HDFC Bank stabilizes and whether global cues from US and Asian markets remain supportive.
Support and Resistance Comparison: Nifty, Bank Nifty & Sensex
Derivative Market Analysis: Option Chain, PCR & OI Insights
PCR Analysis for 21-07-2026
The Nifty PCR (Put-Call Ratio) stands at 1.36, which is meaningfully above the 1.0 neutral threshold. A PCR above 1.2 generally signals that put writers are dominating the derivative market — this implies that institutional sellers of puts are confident that Nifty will hold above key support levels in the near term. The 1.36 reading supports a constructive to mildly bullish stance, though readings above 1.5 would start to signal excessive bullish complacency and potential reversal risk.
Bank Nifty PCR at 0.93 tells a starkly different story. A reading below 1.0 means call writers are more active than put writers — derivative participants are hedging against further downside or actively betting on continued weakness in the banking index. This divergence between Nifty PCR (bullish) and Bank Nifty PCR (cautious) accurately reflects the HDFC Bank-driven stress that is isolated to the banking sector while the broader market remains relatively calm.
OI Analysis and Option Chain Insights
Open Interest buildup analysis reveals that the 24,300 and 24,500 call strikes have seen significant call writing, establishing a ceiling for Nifty in the near term. On the put side, the 24,000 and 24,100 strikes carry heavy put OI, which acts as a floor. This concentration pattern defines a 24,000–24,300 broad range for Nifty with the market gravitating toward the mean.
For Bank Nifty, the 58,000 and 58,500 call strikes carry heavy OI, capping the upside. On the put side, the 57,500 and 57,000 strikes show meaningful put writing, offering support. This option chain analysis aligns with the technical support at 57,533 and resistance at 58,111 — confirming that derivative positioning and technical structure are in sync.
India VIX at 12.9 is in the low-volatility band (below 14), which historically favors option sellers and range-bound strategies like iron condors and short strangles. However, with HDFC Bank's earnings-driven volatility likely to spill over into Monday's session, Bank Nifty options may carry an elevated implied volatility premium that could create opportunities for premium sellers once the initial reaction settles.
Traders should monitor any significant unwinding of put OI at the 24,100 strike for Nifty — if put writers start exiting, it could signal that support is weakening and a downside break may follow. Conversely, fresh call OI buildup above 24,300 would reinforce the resistance zone and keep the range intact. The derivative market analysis for 21-07-2026 favors a cautiously bullish approach for Nifty and a neutral-to-defensive stance for Bank Nifty.
Technical Market Outlook: Chart Patterns and Indicator Analysis
Nifty's daily chart on 20 July formed a bearish candle with a pronounced lower wick, resembling a hammer pattern at the lower end of the recent range. While the close was below the previous session's close — making it technically bearish — the lower wick extending down to 24,135.85 and the subsequent recovery to 24,238.50 suggests that buyers are active at the support zone. A confirmation candle (a bullish close above 24,266 on 21 July) would validate this potential reversal pattern.
The 20-day Exponential Moving Average (EMA) for Nifty is hovering in the 24,200–24,250 zone, and the index is trading near this average — indicating an equilibrium state. A decisive move above the 20 EMA with increasing volume would tilt the short-term bias bullish, while a failure below it would bring the 50 EMA into play as the next support anchor.
RSI (14-period) for Nifty is near the 48–50 zone — firmly neutral territory. This reading does not provide a strong directional signal but does confirm that neither buyers nor sellers have control. A move above RSI 55 would confirm bullish momentum, while a dip below RSI 40 would signal emerging bearishness.
MACD (12, 26, 9) on the daily chart shows the MACD line trending just below the signal line with a flat histogram — a sign of consolidation rather than trending behavior. Traders should watch for a bullish crossover (MACD crossing above the signal line) as a potential buy trigger, or a deepening bearish histogram as a warning of accelerating downside.
Bank Nifty's chart structure is weaker, with the HDFC Bank-driven sell-off creating a long bearish candle that broke below the 20 EMA. The next technical support confluence sits around 57,200–57,300, where the 50 EMA and the D1 downside target at 57,277 converge. A recovery above 58,000 would be needed to neutralize the immediate bearish technical damage.
Sensex technical indicators mirror Nifty's neutral positioning. The opening-at-high and closing-near-low candle on 20 July is a classic bearish engulfing signal relative to the opening, but the fact that Sensex held above the 77,368 support and closed in the upper half of its range is a mixed signal. Bollinger Bands on the daily chart show the Sensex trading near the middle band, confirming the range-bound thesis. The technical market outlook for all three indices points to a consolidation phase where breakout direction will determine the next leg of movement.
Market Analysis and Market Prediction for 21-07-2026
Indian Stock Market Overview
The Indian stock market closed with modest losses on 20 July 2026, with the HDFC Bank post-result sell-off being the dominant narrative. Despite the headline-level decline, breadth was not dramatically negative — the sell-off was concentrated in the banking sector while IT, pharma, and select FMCG names provided some counterbalance. This sector rotation dynamic is critical for the tomorrow market prediction, as it suggests the broader market has underlying resilience.
FII activity remained net negative at -₹1,121.04 Cr, continuing the pattern of foreign institutional selling that has characterized recent sessions. However, DII buying at +₹1,312.03 Cr more than offset the FII outflow, demonstrating that domestic institutional investors remain confident buyers at current levels. This FII-sell-DII-buy equilibrium has been a structural feature of the Indian stock market in 2026 and provides a floor for corrections.
Global Market Cues
GIFT Nifty at 24,256 points to a flat-to-marginally positive opening for Nifty on 21 July. US markets provided mixed-to-stable cues with Dow Jones Future at 52,277, S&P 500 Future at 7,495, and Nasdaq Future at 28,867 — all indicating steady performance in the overnight US session. The technology-heavy Nasdaq's stability is encouraging for Indian IT stocks, which could provide offsetting support if banking pressure persists.
Asian market futures present a constructive picture. Nikkei Future at 65,652 and Hang Seng Future at 25,086 both indicate positive Asian market sentiment heading into Monday's Asian trading session. A positive Asian opening could provide early-session tailwinds for Indian equities, particularly if Chinese economic data or Bank of Japan policy signals come in favorably over the weekend.
Macro Context: Crude Oil, Currency & Bond Yields
Brent Crude Oil at $87.62 is an area of concern for the Indian market. Crude oil prices above $85 historically exert pressure on India's current account deficit and inflation trajectory. If crude sustains above $88–90, it could trigger negative sentiment in rate-sensitive sectors and add to the macro headwinds already created by the HDFC Bank result shock.
USD/INR at 96.54 shows the rupee remains under moderate depreciation pressure. A weaker rupee makes FII returns less attractive in dollar terms, potentially discouraging fresh foreign inflows. However, RBI intervention and India's robust foreign exchange reserves should prevent any disorderly depreciation. The combined effect of elevated crude and a soft rupee warrants caution, particularly for importing sectors.
The stock market prediction for 21-07-2026 leans constructive for Nifty and Sensex, with the GIFT Nifty signal suggesting a mild positive opening. Bank Nifty remains the wild card — if HDFC Bank stabilizes, the broader sentiment could improve quickly. If HDFC Bank sees follow-through selling, Bank Nifty may underperform even as Nifty holds its ground. The share market prediction favors sector-selective positioning over broad-based directional bets.
Trading Strategy for 21-07-2026
Trading Strategy for 21-07-2026 — Decision Framework
Entry: Above 24,266 (15m close)
Targets: 24,368 → 24,473 → 24,530
Stop-Loss: 24,135
Book: 70% at U1, 15% at U2, 15% at U3
Entry: Below 24,135 (15m close)
Targets: 24,051 → 23,928 → 23,804
Stop-Loss: 24,266
Book: 70% at D1, 15% at D2, 15% at D3
Condition: Between 24,135–24,266
Action: Scalp only, tight SL
Strategy: Wait for breakout/breakdown
Risk: Keep position size small
⚠ Risk Warning: In a big gap-up or gap-down session, most of these supplied levels can become invalid quickly. Treat all levels as strategic probability zones rather than guaranteed outcome lines. Always use a stop-loss and never risk more than 1–2% of your trading capital on a single trade. The profit-booking discipline of 70%–15%–15% across targets with trailing stop-loss protection is essential for consistent performance.
Overall Market Sentiment — 21-07-2026
Useful Tools and Resources
Frequently Asked Questions
Disclaimer: This article is published by Option Matrix India for educational and informational purposes only. It does not constitute financial advice, investment recommendation, or solicitation to buy or sell any securities. Stock market investments are subject to market risks. Past performance does not guarantee future results. The levels, predictions, and analysis provided are based on technical analysis methodologies and should be treated as probability-based zones, not certainties. Always consult a SEBI-registered financial advisor before making any trading or investment decisions. The author and Option Matrix India are not liable for any losses incurred based on the content of this article. Trade responsibly.