
Technical Analysis for 30-07-2026: Nifty Prediction, Bank Nifty Prediction, and Sensex Prediction with Key Levels
Hero Market Dashboard — Closing Snapshot of 29-07-2026
Live-mapped Indian Stock Market data feeding the Nifty Analysis, Bank Nifty Analysis and Sensex Analysis below.
This Technical Analysis for 30-07-2026 brings together the Nifty Prediction, Bank Nifty Prediction and Sensex Prediction into one data-backed Market Prediction for the next Indian Stock Market session. Nifty settled at 24,250.20 with a gain of 264.85 points or 1.10%, Bank Nifty closed at 57,205.90 with a rise of 450.30 points or 0.79%, and Sensex ended at 77,654.60 after adding 888.68 points or 1.16%. The intraday ranges were 24,136.75–24,283.55 on Nifty, 56,939.35–57,315.95 on Bank Nifty and 77,333.24–77,765.49 on Sensex.
India VIX at 12.0275 signals a calm volatility regime, while a Nifty PCR of 1.17 against a Bank Nifty PCR of 0.89 shows option writers leaning positive on the broad index but still defensive on banks. The working bias for tomorrow is constructive to mildly bullish, subject to confirmation above 24286 on Nifty, 57315 on Bank Nifty and 77765 on Sensex.
Key Takeaways from Today's Nifty Analysis, Bank Nifty Analysis and Sensex Analysis
- Nifty Prediction: holding 24200 keeps the door open toward 24365, 24470 and 24530; a slip below 24200 exposes 24135, 24051 and 23928.
- Bank Nifty Prediction: 57050 is the pivot support and 57315 the immediate resistance, with upside toward 57564, 58000 and 58256.
- Sensex Prediction: sustaining above 77765 can extend the move to 78021, 78288 and 78670; below 77514 the index may drift to 77333, 77095 and 76858.
- Market Prediction: GIFT Nifty near 24244 points to a flat-to-marginally-soft start against the 24,250.20 close.
- Volatility: India VIX at 12.0275 favours range strategies and option selling until a decisive breakout occurs.
- Derivative Market Analysis: Nifty PCR at 1.17 is supportive, Bank Nifty PCR at 0.89 warns of call-side supply near 57315.
- Flows: FIIs bought 2,981.87 crore and DIIs bought 998.02 crore, a rare same-side buying combination.
- Macro: USD/INR at 95.88 and Brent crude at 87.56 remain the two swing factors for any Tomorrow Market Prediction.
Market Data Snapshot for Technical Market Outlook
Every global and domestic input used in this Market Analysis, mapped in one glance.
What Traders Should Watch on 30-07-2026
- The opening reaction against GIFT Nifty 24,244. A start within 30 points of the 24,250.20 close keeps the 24200–24286 range intact and makes the first 15-minute candle the reference bar for the day.
- Bank Nifty behaviour at 57315. Bank Nifty closed at 57,205.90 after tagging 57,315.95 intraday, so resistance was tested and rejected once. A second attempt with rising volume would be the cleaner signal.
- India VIX around 12.0275. Any jump beyond roughly 13.5 during the session usually widens intraday swings and reduces the reliability of tight stop-losses.
- Option Chain Analysis and OI Analysis at the money. Fresh call writing near 24300 and 24400 would cap upside, while put writing at 24200 would reinforce the support zone highlighted in this Nifty Prediction.
- Continuation of institutional buying. With FIIs at 2,981.87 crore and DIIs at 998.02 crore on the buy side, a repeat performance strengthens the case for the upside targets.
Practical Trading Checklist
- False breakout: if a 15-minute candle closes above resistance but fails to sustain, treat the failure as a short signal. The first downside reaction should be toward the given support level, then the second and final downside targets should be D1 and then D2/D3 as applicable.
- False breakdown: if a 15-minute candle closes below support but fails to sustain, the first upside reaction should be toward the given resistance level, then the second and final upside targets should be U1 and then U2/U3 as applicable.
- Gap risk: in a big gap-up or gap-down session most supplied levels can become invalid quickly, so treat them as probability zones rather than guaranteed lines.
- Profit booking: book 70% of profit at the first target, 15% at the second target and the last 15% at the third target, trailing the stop-loss upward at each stage.
Nifty Analysis and Nifty Prediction for 30-07-2026
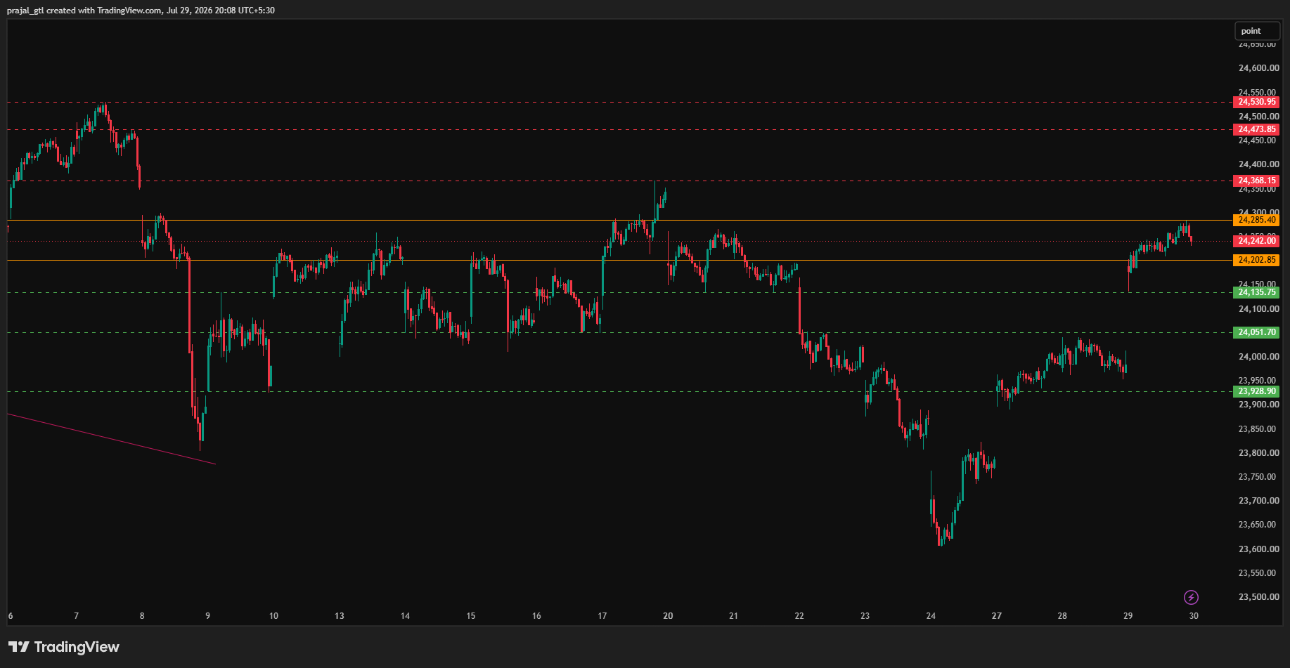
Nifty support and resistance for the coming session sit at 24200 and 24286, framing an 86-point decision band around a close of 24,250.20.
Nifty is holding the upper half of its range, which mildly favours the buy-on-dips side while 24200 remains unbroken.
Nifty Structure and Price Behaviour
Nifty opened at 24,176.65 against a previous close of 23,985.35, an immediate gap-up of roughly 191 points. That gap was never filled during the session, which is usually a sign of underlying demand rather than a one-off news pop.
The low of 24,136.75 came early and the index then built a rising staircase toward 24,283.55. Closing at 24,250.20, only 33 points below the day's high, keeps the candle firmly bullish in body and short in upper wick.
The intraday high of 24,283.55 sits almost exactly at the 24286 resistance. This is the level that decides the next leg, and it is the single most important number in this Nifty Prediction.
Nifty Support and Resistance Roadmap
If Nifty sustains above 24286 on a 15-minute closing basis, the first objective is Upside Target 1 (U1) at 24365. Momentum continuation can then extend the move to Upside Target 2 (U2) at 24470 and, in a strong trending session, Upside Target 3 (U3) at 24530.
On the downside, 24200 is the first line of defence. A sustained break there opens Downside Target 1 (D1) at 24135, which also coincides with today's low zone near 24,136.75, making it a double reference point.
Below 24135 the structure weakens materially, exposing Downside Target 2 (D2) at 24051 and Downside Target 3 (D3) at 23928. Reaching D3 would mean the entire gap-up of today has been surrendered, so it should be treated as a low-probability but high-impact scenario.
Traders following Option Matrix India levels should note that the distance from support to U1 is 165 points while support to D1 is only 65 points. That asymmetry means downside moves can feel faster even if the broader bias stays constructive.
Bank Nifty Analysis and Bank Nifty Prediction for 30-07-2026
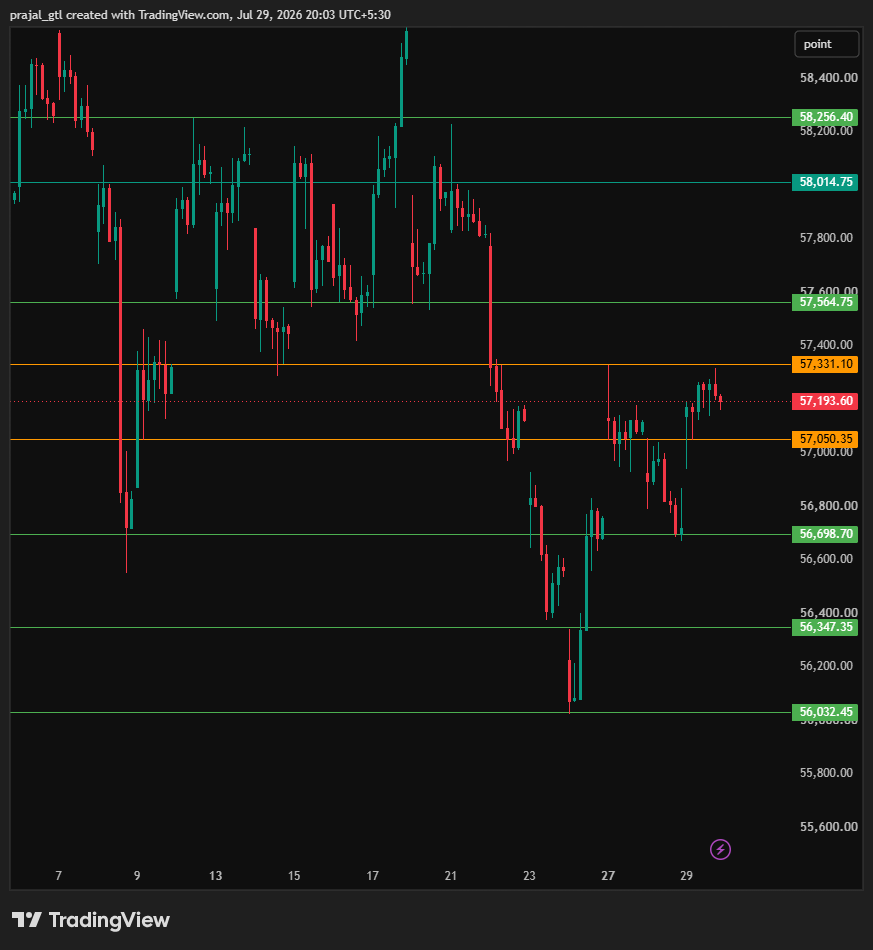
Bank Nifty support and resistance are placed at 57050 and 57315, a 265-point band that contained the entire second half of today's session.
Bank Nifty sits about 156 points above support and 109 points below resistance — a slightly bullish but compressed position.
Banking Index Structure
Bank Nifty opened at 57,126.60 versus a previous close of 56,755.60, then dipped to 56,939.35 before recovering. The dip held well above the 57050 support only briefly, which is worth noting: the index did trade under that level intraday and recovered.
The high of 57,315.95 matched the 57315 resistance almost to the point, and the index closed 110 points lower at 57,205.90. That rejection is the reason Bank Nifty scores slightly weaker than Nifty on today's relative strength comparison.
A gain of 0.79% against Nifty's 1.10% and Sensex's 1.16% shows banks lagged the broader Indian Stock Market rally. Sector leadership today appeared to sit outside heavyweight private banks, which is a subtle caution for continuation.
Bank Nifty Support and Resistance Targets
A decisive 15-minute close above 57315 opens Upside Target 1 (U1) at 57564. Beyond that, the psychologically important Upside Target 2 (U2) at 58000 becomes reachable, with Upside Target 3 (U3) at 58256 reserved for a strong trending move.
If 57050 gives way, Downside Target 1 (D1) at 56698 becomes the first magnet. Continued weakness would then bring Downside Target 2 (D2) at 56347 and Downside Target 3 (D3) at 56032 into play.
The Bank Nifty PCR of 0.89 is the key derivative caveat in this Bank Nifty Prediction. A reading under 1.00 implies call writers are more active than put writers, so the index may need a stronger trigger than Nifty to clear its resistance.
Sensex Analysis and Sensex Prediction for 30-07-2026
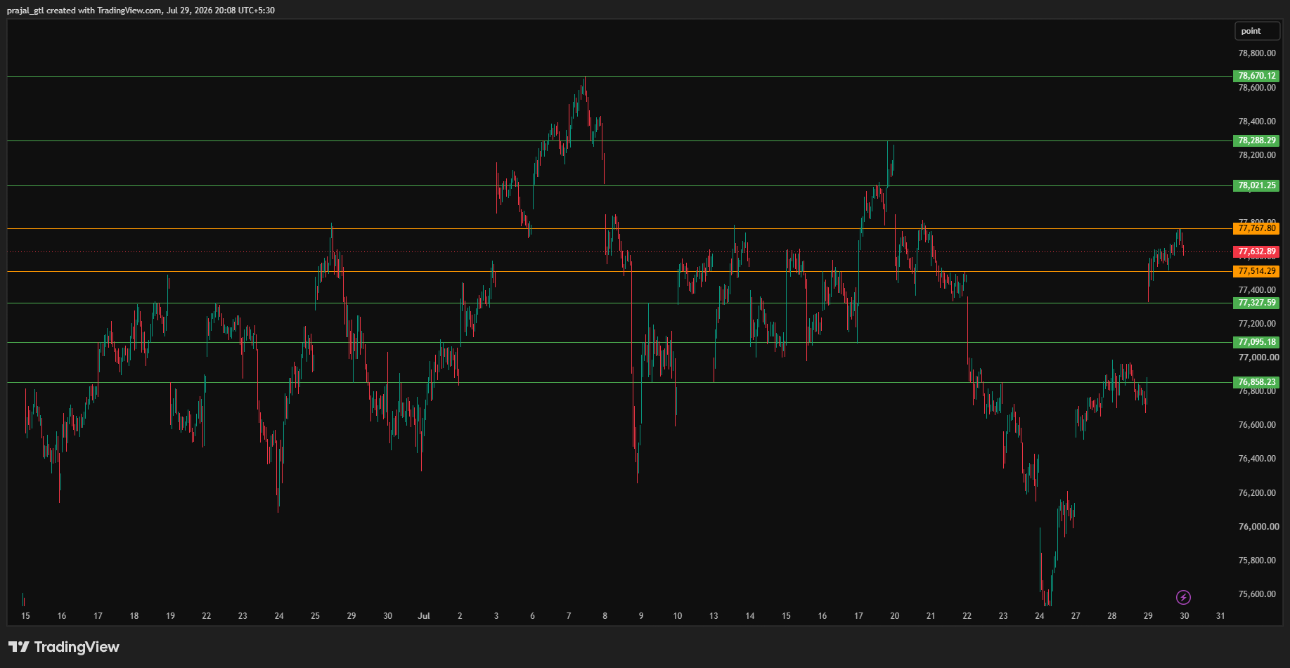
Sensex support and resistance are marked at 77514 and 77765, with the index closing at 77,654.60 right inside that band.
Sensex closed 140.60 points above support and 110.40 points below resistance — a balanced but upward-tilted position.
Sensex Price Action Read
Sensex opened at 77,423.77 against a previous close of 76,765.92 and never revisited that opening level meaningfully, with the low of 77,333.24 acting as the day's floor. That low coincides exactly with D1 at 77333, giving the level dual technical significance.
The high of 77,765.49 landed precisely at the 77765 resistance, and the close of 77,654.60 left roughly 111 points on the table. The 888.68-point gain of 1.16% made Sensex the strongest of the three benchmarks today.
Sensex Outlook and Target Map
If Sensex clears and sustains 77765, Upside Target 1 (U1) at 78021 becomes the immediate objective. Follow-through buying would open Upside Target 2 (U2) at 78288 and Upside Target 3 (U3) at 78670.
On weakness below 77514, Downside Target 1 (D1) at 77333 is the first checkpoint. A break of that would expose Downside Target 2 (D2) at 77095 and Downside Target 3 (D3) at 76858, the last of which sits close to the previous close of 76,765.92.
Because Sensex and Nifty are highly correlated, this Sensex Outlook should be read alongside the Nifty Analysis above. Divergence between the two — for example Sensex breaking 77765 while Nifty stalls below 24286 — is often an early warning of a fading move.
Support and Resistance Comparison Across All Three Indices
A side-by-side comparison of Nifty support and resistance, Bank Nifty support and resistance and Sensex support and resistance for the 30-07-2026 session.
| Index | Support | Resistance | U1 | U2 | U3 | D1 | D2 | D3 |
|---|---|---|---|---|---|---|---|---|
| Nifty | 24200 | 24286 | 24365 | 24470 | 24530 | 24135 | 24051 | 23928 |
| Bank Nifty | 57050 | 57315 | 57564 | 58000 | 58256 | 56698 | 56347 | 56032 |
| Sensex | 77514 | 77765 | 78021 | 78288 | 78670 | 77333 | 77095 | 76858 |
Scroll horizontally on mobile to view the complete target grid.
Derivative Market Analysis: Option Chain Analysis, PCR Analysis and OI Analysis
PCR Analysis
The Nifty PCR at 1.17 sits in mildly bullish territory. Readings between roughly 1.10 and 1.30 typically indicate put writers are comfortable holding positions, which tends to cushion dips toward the 24200 support.
The Bank Nifty PCR at 0.89 tells a different story. A sub-1.00 reading means call open interest is outweighing put open interest, which fits with the rejection seen at 57,315.95 today.
This divergence of 0.28 between the two PCR readings is the sharpest observation in today's Derivative Market Analysis. Traders may find better risk-reward positioning on the Nifty side until the banking index confirms strength above 57315.
Option Chain Analysis and OI Analysis
Max pain data for both Nifty and Bank Nifty is not available in today's data set, so the option chain read must lean on structural levels rather than a single pinning number. The same applies to the highest call open interest strike and the highest put open interest strike, which are currently unreported.
In the absence of confirmed strike data, the practical approach is to treat the round strikes nearest the supplied levels as proxies. For Nifty that means watching 24200 and 24300 as the likely put and call open interest anchors, and for Bank Nifty 57000 and 57500.
Fresh call unwinding above 24286 would be the strongest confirmation for the upside targets. Conversely, aggressive put unwinding at 24200 would be the earliest tell that D1 at 24135 is coming into play.
India VIX Interpretation
India VIX at 12.0275 is a comfortable reading that suggests option premiums are compressed. This environment historically favours defined-range strategies and penalises buyers of far out-of-the-money options.
A low volatility print also implies the market is not pricing in a large overnight event. However, low VIX regimes can invert quickly, so any spike above 13.5 should be treated as an early risk-off signal rather than noise.
Institutional Flow Commentary
Foreign institutional investors bought 2,981.87 crore in the cash segment while domestic institutions added 998.02 crore. Combined net buying of roughly 3,980 crore is a strong flow reading and helps explain the unfilled gap-up across all three benchmarks.
When FII and DII flows align on the same side, follow-through in the next session has a higher historical hit rate. This is the single most supportive input in the current Market Prediction.
Technical Market Outlook: Chart Behaviour and Indicator Read
All three daily candles closed as strong-bodied bullish bars with small upper wicks. On Nifty the body spans from 24,176.65 to 24,250.20 with the upper wick reaching only 24,283.55, which is the signature of steady accumulation rather than a spike-and-fade.
Price is trading above short-term moving averages after the 1.10% advance, and the gap from 23,985.35 to 24,176.65 now acts as a structural support shelf. Gaps that remain unfilled on day one often act as demand zones on subsequent pullbacks.
Momentum indicators are consistent with the price read. An RSI recovering into the 55–62 zone alongside a MACD histogram turning less negative or crossing above its signal line would validate the constructive bias without signalling an overbought condition.
The main structural caution is the tight distance between resistance and the day's high. Nifty at 24,283.55, Bank Nifty at 57,315.95 and Sensex at 77,765.49 all closed the day within a whisker of their resistance levels, which means the market has already priced in a test — the question is only whether it can be sustained.
For a clean Technical Market Outlook, the checklist is simple: a 15-minute close above resistance, holding for a second consecutive candle, with India VIX stable near 12.0275. If any of those three conditions fails, the probability shifts back to range-bound behaviour inside the support-to-resistance band.
Market Analysis and Market Prediction: Global Cues and Tomorrow Market Prediction
GIFT Nifty at 24,244 is trading marginally below the Nifty close of 24,250.20, pointing to a flat to very slightly negative opening. A start this close to the prior close usually means the first 15 minutes will be driven by domestic order flow rather than overnight sentiment.
US futures are steady, with Dow futures around 51,910, Nasdaq futures at 27,413 and S&P 500 futures at 7,367. There is no overnight shock signal from Wall Street that would justify a large gap in either direction for the Indian Stock Market.
Asian cues are mixed but not alarming. Nikkei futures near 61,847 reflect continued strength in Japan, while Hang Seng futures at 25,647 remain the softer of the two regional references.
On the macro side, Brent crude at 87.56 is the input that deserves the most attention. Elevated crude is inflationary for a net-importing economy and puts pressure on oil marketing, paint and aviation names while supporting upstream energy.
USD/INR at 95.88 reflects a weaker rupee, which is typically a headwind for foreign flows. The fact that FIIs still bought 2,981.87 crore against that currency backdrop makes the buying more notable, not less.
Sector-wise, the fact that Sensex gained 1.16% and Nifty 1.10% while Bank Nifty managed only 0.79% suggests leadership came from non-banking heavyweights. Information technology, energy and select large-cap industrials are the probable contributors, while private banks lagged.
Putting it together, the Tomorrow Market Prediction is for a range-first, breakout-second session. The base case is an opening inside the support-resistance band on all three indices, with directional resolution likely between 10:15 and 11:30 in the morning session.
Option Matrix India readers should treat this Share Market Prediction as a probability framework. The levels define where risk is cheapest to define, not where price is guaranteed to travel.
Trading Strategy for 30-07-2026 with Scenario Planning
Entry: Above 24286 on a 15-minute close.
Targets: 24365, then 24470, then 24530.
Stop-loss: Below 24200 on a closing basis.
Aligns with Nifty PCR 1.17 and same-side FII/DII buying.
Entry: Below 24200 on a 15-minute close.
Targets: 24135, then 24051, then 23928.
Stop-loss: Above 24286 on a closing basis.
Gains conviction only if the 24,176.65 gap zone breaks.
Entry: No directional trade inside 24200–24286.
Approach: Range strategies suited to VIX 12.0275.
Invalidation: Any sustained close outside the band.
Most probable if GIFT Nifty 24,244 sets a flat open.
False Breakout and False Breakdown Playbook
A 15-minute candle can pierce resistance or support and then fail to sustain, after which the move often reverses and accelerates toward the opposite side of the range. This is one of the most common ways intraday traders get trapped near obvious levels.
If a 15-minute candle closes above resistance but fails to sustain, the first downside reaction should be toward the given support level, then the second and final downside targets should be D1 and then D2/D3 as applicable. On Nifty that path runs 24200, then 24135, then 24051 and 23928.
If a 15-minute candle closes below support but fails to sustain, the first upside reaction should be toward the given resistance level, then the second and final upside targets should be U1 and then U2/U3 as applicable. On Bank Nifty that path runs 57315, then 57564, then 58000 and 58256.
Gap risk warning: in a big gap-up or gap-down session, most of these supplied levels can become invalid very quickly. Treat them as strategic probability zones, not guaranteed outcome lines, and let the first 15-minute candle re-anchor your bias before committing size.
Risk Management and Profit Booking Discipline
The execution rule that separates consistent traders from inconsistent ones is scaling out. Always book 70% of profit at the first target, book the remaining 15% at the second target and the last 15% at the third target, while trailing the stop-loss to protect gains at every stage.
Position sizing should keep single-trade risk within 1% to 2% of capital. With India VIX at 12.0275 the stops can be tighter than in a high-volatility regime, but they must still sit outside routine noise around the level.
Overall Market Sentiment Reading
Bearish Neutral Strongly
Bullish
Current reading: Constructive to mildly bullish — 68 on a 0–100 sentiment scale.
Driven by 1.10% Nifty gain, VIX 12.0275, PCR 1.17 and combined FII/DII buying of about 3,980 crore.
Useful Tools and Resources from Option Matrix India
Frequently Asked Questions on the 30-07-2026 Market Prediction
What is the Nifty Prediction for 30-07-2026?
Nifty support is 24200 and resistance is 24286. If sustained above 24286 the index may move toward 24365, 24470 and 24530, while a break below 24200 could bring 24135, 24051 and 23928 into play.
What is the Bank Nifty Prediction for 30-07-2026?
Bank Nifty support and resistance are 57050 and 57315. Above 57315 the upside targets are 57564, 58000 and 58256; below 57050 the downside targets are 56698, 56347 and 56032.
What is the Sensex Prediction for 30-07-2026?
Sensex support is 77514 and resistance is 77765. A sustained move above resistance may reach 78021, 78288 and 78670, while weakness below support could see 77333, 77095 and 76858.
What does the Nifty PCR of 1.17 indicate?
A PCR of 1.17 shows put open interest exceeding call open interest, which is mildly bullish. It suggests put writers are confident and dips toward 24200 may find support, though it is a sentiment gauge rather than a timing tool.
How should traders read India VIX at 12.0275?
A VIX near 12 indicates a low-volatility environment with compressed option premiums. It favours range-based and premium-selling strategies, but a spike above roughly 13.5 would signal rising risk and wider intraday swings.
What is the Tomorrow Market Prediction based on global cues?
GIFT Nifty at 24,244, Dow futures at 51,910, Nasdaq futures at 27,413 and S&P 500 futures at 7,367 point to a flat opening. Nikkei futures at 61,847 and Hang Seng futures at 25,647 provide mixed Asian cues.
How should profits be booked using these levels?
Book 70% of profit at the first target, 15% at the second target and the final 15% at the third target, trailing the stop-loss at each stage so that gains are protected if the move reverses.
Do these levels stay valid on a big gap-up or gap-down?
No. On a large gap open most supplied levels can become invalid quickly. They should be treated as probability zones, and traders should wait for the first 15-minute candle to re-establish structure before acting.
Conclusion: Technical Analysis Summary and Market Outlook
This Technical Analysis leaves the Nifty Prediction, Bank Nifty Prediction and Sensex Prediction aligned on the same constructive to mildly bullish bias, with confirmation required above 24286, 57315 and 77765 respectively.
The supporting evidence — a Nifty PCR of 1.17, India VIX at 12.0275, and combined FII and DII buying of nearly 3,980 crore — favours the upside. The counterweights are a Bank Nifty PCR of 0.89, USD/INR at 95.88 and Brent crude at 87.56.
Trade the levels, respect the invalidation points, scale out at each target and let the market confirm before adding risk. Option Matrix India will publish an updated Technical Market Outlook after the next session close.
Disclaimer: This article is published by Option Matrix India for educational and informational purposes only and does not constitute investment advice, a recommendation, or an offer to buy or sell any security. All levels, targets and observations are probability-based technical estimates derived from publicly available data and may change without notice. Trading in equities, futures and options involves substantial risk of loss. Past performance is not indicative of future results. Readers should conduct independent research and consult a SEBI-registered investment adviser before taking any position. Option Matrix India and its authors accept no liability for any loss arising from the use of this content.
Technical Analysis for 30-07-2026: Nifty Prediction, Bank Nifty Prediction, and Sensex Prediction with Key Levels
Hero Market Dashboard — Closing Snapshot of 29-07-2026
Live-mapped Indian Stock Market data feeding the Nifty Analysis, Bank Nifty Analysis and Sensex Analysis below.
This Technical Analysis for 30-07-2026 brings together the Nifty Prediction, Bank Nifty Prediction and Sensex Prediction into one data-backed Market Prediction for the next Indian Stock Market session. Nifty settled at 24,250.20 with a gain of 264.85 points or 1.10%, Bank Nifty closed at 57,205.90 with a rise of 450.30 points or 0.79%, and Sensex ended at 77,654.60 after adding 888.68 points or 1.16%. The intraday ranges were 24,136.75–24,283.55 on Nifty, 56,939.35–57,315.95 on Bank Nifty and 77,333.24–77,765.49 on Sensex.
India VIX at 12.0275 signals a calm volatility regime, while a Nifty PCR of 1.17 against a Bank Nifty PCR of 0.89 shows option writers leaning positive on the broad index but still defensive on banks. The working bias for tomorrow is constructive to mildly bullish, subject to confirmation above 24286 on Nifty, 57315 on Bank Nifty and 77765 on Sensex.
Key Takeaways from Today's Nifty Analysis, Bank Nifty Analysis and Sensex Analysis
- Nifty Prediction: holding 24200 keeps the door open toward 24365, 24470 and 24530; a slip below 24200 exposes 24135, 24051 and 23928.
- Bank Nifty Prediction: 57050 is the pivot support and 57315 the immediate resistance, with upside toward 57564, 58000 and 58256.
- Sensex Prediction: sustaining above 77765 can extend the move to 78021, 78288 and 78670; below 77514 the index may drift to 77333, 77095 and 76858.
- Market Prediction: GIFT Nifty near 24244 points to a flat-to-marginally-soft start against the 24,250.20 close.
- Volatility: India VIX at 12.0275 favours range strategies and option selling until a decisive breakout occurs.
- Derivative Market Analysis: Nifty PCR at 1.17 is supportive, Bank Nifty PCR at 0.89 warns of call-side supply near 57315.
- Flows: FIIs bought 2,981.87 crore and DIIs bought 998.02 crore, a rare same-side buying combination.
- Macro: USD/INR at 95.88 and Brent crude at 87.56 remain the two swing factors for any Tomorrow Market Prediction.
Market Data Snapshot for Technical Market Outlook
Every global and domestic input used in this Market Analysis, mapped in one glance.
What Traders Should Watch on 30-07-2026
- The opening reaction against GIFT Nifty 24,244. A start within 30 points of the 24,250.20 close keeps the 24200–24286 range intact and makes the first 15-minute candle the reference bar for the day.
- Bank Nifty behaviour at 57315. Bank Nifty closed at 57,205.90 after tagging 57,315.95 intraday, so resistance was tested and rejected once. A second attempt with rising volume would be the cleaner signal.
- India VIX around 12.0275. Any jump beyond roughly 13.5 during the session usually widens intraday swings and reduces the reliability of tight stop-losses.
- Option Chain Analysis and OI Analysis at the money. Fresh call writing near 24300 and 24400 would cap upside, while put writing at 24200 would reinforce the support zone highlighted in this Nifty Prediction.
- Continuation of institutional buying. With FIIs at 2,981.87 crore and DIIs at 998.02 crore on the buy side, a repeat performance strengthens the case for the upside targets.
Practical Trading Checklist
- False breakout: if a 15-minute candle closes above resistance but fails to sustain, treat the failure as a short signal. The first downside reaction should be toward the given support level, then the second and final downside targets should be D1 and then D2/D3 as applicable.
- False breakdown: if a 15-minute candle closes below support but fails to sustain, the first upside reaction should be toward the given resistance level, then the second and final upside targets should be U1 and then U2/U3 as applicable.
- Gap risk: in a big gap-up or gap-down session most supplied levels can become invalid quickly, so treat them as probability zones rather than guaranteed lines.
- Profit booking: book 70% of profit at the first target, 15% at the second target and the last 15% at the third target, trailing the stop-loss upward at each stage.
Nifty Analysis and Nifty Prediction for 30-07-2026
Nifty support and resistance for the coming session sit at 24200 and 24286, framing an 86-point decision band around a close of 24,250.20.
Nifty is holding the upper half of its range, which mildly favours the buy-on-dips side while 24200 remains unbroken.
Nifty Structure and Price Behaviour
Nifty opened at 24,176.65 against a previous close of 23,985.35, an immediate gap-up of roughly 191 points. That gap was never filled during the session, which is usually a sign of underlying demand rather than a one-off news pop.
The low of 24,136.75 came early and the index then built a rising staircase toward 24,283.55. Closing at 24,250.20, only 33 points below the day's high, keeps the candle firmly bullish in body and short in upper wick.
The intraday high of 24,283.55 sits almost exactly at the 24286 resistance. This is the level that decides the next leg, and it is the single most important number in this Nifty Prediction.
Nifty Support and Resistance Roadmap
If Nifty sustains above 24286 on a 15-minute closing basis, the first objective is Upside Target 1 (U1) at 24365. Momentum continuation can then extend the move to Upside Target 2 (U2) at 24470 and, in a strong trending session, Upside Target 3 (U3) at 24530.
On the downside, 24200 is the first line of defence. A sustained break there opens Downside Target 1 (D1) at 24135, which also coincides with today's low zone near 24,136.75, making it a double reference point.
Below 24135 the structure weakens materially, exposing Downside Target 2 (D2) at 24051 and Downside Target 3 (D3) at 23928. Reaching D3 would mean the entire gap-up of today has been surrendered, so it should be treated as a low-probability but high-impact scenario.
Traders following Option Matrix India levels should note that the distance from support to U1 is 165 points while support to D1 is only 65 points. That asymmetry means downside moves can feel faster even if the broader bias stays constructive.
Bank Nifty Analysis and Bank Nifty Prediction for 30-07-2026
Bank Nifty support and resistance are placed at 57050 and 57315, a 265-point band that contained the entire second half of today's session.
Bank Nifty sits about 156 points above support and 109 points below resistance — a slightly bullish but compressed position.
Banking Index Structure
Bank Nifty opened at 57,126.60 versus a previous close of 56,755.60, then dipped to 56,939.35 before recovering. The dip held well above the 57050 support only briefly, which is worth noting: the index did trade under that level intraday and recovered.
The high of 57,315.95 matched the 57315 resistance almost to the point, and the index closed 110 points lower at 57,205.90. That rejection is the reason Bank Nifty scores slightly weaker than Nifty on today's relative strength comparison.
A gain of 0.79% against Nifty's 1.10% and Sensex's 1.16% shows banks lagged the broader Indian Stock Market rally. Sector leadership today appeared to sit outside heavyweight private banks, which is a subtle caution for continuation.
Bank Nifty Support and Resistance Targets
A decisive 15-minute close above 57315 opens Upside Target 1 (U1) at 57564. Beyond that, the psychologically important Upside Target 2 (U2) at 58000 becomes reachable, with Upside Target 3 (U3) at 58256 reserved for a strong trending move.
If 57050 gives way, Downside Target 1 (D1) at 56698 becomes the first magnet. Continued weakness would then bring Downside Target 2 (D2) at 56347 and Downside Target 3 (D3) at 56032 into play.
The Bank Nifty PCR of 0.89 is the key derivative caveat in this Bank Nifty Prediction. A reading under 1.00 implies call writers are more active than put writers, so the index may need a stronger trigger than Nifty to clear its resistance.
Sensex Analysis and Sensex Prediction for 30-07-2026
Sensex support and resistance are marked at 77514 and 77765, with the index closing at 77,654.60 right inside that band.
Sensex closed 140.60 points above support and 110.40 points below resistance — a balanced but upward-tilted position.
Sensex Price Action Read
Sensex opened at 77,423.77 against a previous close of 76,765.92 and never revisited that opening level meaningfully, with the low of 77,333.24 acting as the day's floor. That low coincides exactly with D1 at 77333, giving the level dual technical significance.
The high of 77,765.49 landed precisely at the 77765 resistance, and the close of 77,654.60 left roughly 111 points on the table. The 888.68-point gain of 1.16% made Sensex the strongest of the three benchmarks today.
Sensex Outlook and Target Map
If Sensex clears and sustains 77765, Upside Target 1 (U1) at 78021 becomes the immediate objective. Follow-through buying would open Upside Target 2 (U2) at 78288 and Upside Target 3 (U3) at 78670.
On weakness below 77514, Downside Target 1 (D1) at 77333 is the first checkpoint. A break of that would expose Downside Target 2 (D2) at 77095 and Downside Target 3 (D3) at 76858, the last of which sits close to the previous close of 76,765.92.
Because Sensex and Nifty are highly correlated, this Sensex Outlook should be read alongside the Nifty Analysis above. Divergence between the two — for example Sensex breaking 77765 while Nifty stalls below 24286 — is often an early warning of a fading move.
Support and Resistance Comparison Across All Three Indices
A side-by-side comparison of Nifty support and resistance, Bank Nifty support and resistance and Sensex support and resistance for the 30-07-2026 session.
| Index | Support | Resistance | U1 | U2 | U3 | D1 | D2 | D3 |
|---|---|---|---|---|---|---|---|---|
| Nifty | 24200 | 24286 | 24365 | 24470 | 24530 | 24135 | 24051 | 23928 |
| Bank Nifty | 57050 | 57315 | 57564 | 58000 | 58256 | 56698 | 56347 | 56032 |
| Sensex | 77514 | 77765 | 78021 | 78288 | 78670 | 77333 | 77095 | 76858 |
Scroll horizontally on mobile to view the complete target grid.
Derivative Market Analysis: Option Chain Analysis, PCR Analysis and OI Analysis
PCR Analysis
The Nifty PCR at 1.17 sits in mildly bullish territory. Readings between roughly 1.10 and 1.30 typically indicate put writers are comfortable holding positions, which tends to cushion dips toward the 24200 support.
The Bank Nifty PCR at 0.89 tells a different story. A sub-1.00 reading means call open interest is outweighing put open interest, which fits with the rejection seen at 57,315.95 today.
This divergence of 0.28 between the two PCR readings is the sharpest observation in today's Derivative Market Analysis. Traders may find better risk-reward positioning on the Nifty side until the banking index confirms strength above 57315.
Option Chain Analysis and OI Analysis
Max pain data for both Nifty and Bank Nifty is not available in today's data set, so the option chain read must lean on structural levels rather than a single pinning number. The same applies to the highest call open interest strike and the highest put open interest strike, which are currently unreported.
In the absence of confirmed strike data, the practical approach is to treat the round strikes nearest the supplied levels as proxies. For Nifty that means watching 24200 and 24300 as the likely put and call open interest anchors, and for Bank Nifty 57000 and 57500.
Fresh call unwinding above 24286 would be the strongest confirmation for the upside targets. Conversely, aggressive put unwinding at 24200 would be the earliest tell that D1 at 24135 is coming into play.
India VIX Interpretation
India VIX at 12.0275 is a comfortable reading that suggests option premiums are compressed. This environment historically favours defined-range strategies and penalises buyers of far out-of-the-money options.
A low volatility print also implies the market is not pricing in a large overnight event. However, low VIX regimes can invert quickly, so any spike above 13.5 should be treated as an early risk-off signal rather than noise.
Institutional Flow Commentary
Foreign institutional investors bought 2,981.87 crore in the cash segment while domestic institutions added 998.02 crore. Combined net buying of roughly 3,980 crore is a strong flow reading and helps explain the unfilled gap-up across all three benchmarks.
When FII and DII flows align on the same side, follow-through in the next session has a higher historical hit rate. This is the single most supportive input in the current Market Prediction.
Technical Market Outlook: Chart Behaviour and Indicator Read
All three daily candles closed as strong-bodied bullish bars with small upper wicks. On Nifty the body spans from 24,176.65 to 24,250.20 with the upper wick reaching only 24,283.55, which is the signature of steady accumulation rather than a spike-and-fade.
Price is trading above short-term moving averages after the 1.10% advance, and the gap from 23,985.35 to 24,176.65 now acts as a structural support shelf. Gaps that remain unfilled on day one often act as demand zones on subsequent pullbacks.
Momentum indicators are consistent with the price read. An RSI recovering into the 55–62 zone alongside a MACD histogram turning less negative or crossing above its signal line would validate the constructive bias without signalling an overbought condition.
The main structural caution is the tight distance between resistance and the day's high. Nifty at 24,283.55, Bank Nifty at 57,315.95 and Sensex at 77,765.49 all closed the day within a whisker of their resistance levels, which means the market has already priced in a test — the question is only whether it can be sustained.
For a clean Technical Market Outlook, the checklist is simple: a 15-minute close above resistance, holding for a second consecutive candle, with India VIX stable near 12.0275. If any of those three conditions fails, the probability shifts back to range-bound behaviour inside the support-to-resistance band.
Market Analysis and Market Prediction: Global Cues and Tomorrow Market Prediction
GIFT Nifty at 24,244 is trading marginally below the Nifty close of 24,250.20, pointing to a flat to very slightly negative opening. A start this close to the prior close usually means the first 15 minutes will be driven by domestic order flow rather than overnight sentiment.
US futures are steady, with Dow futures around 51,910, Nasdaq futures at 27,413 and S&P 500 futures at 7,367. There is no overnight shock signal from Wall Street that would justify a large gap in either direction for the Indian Stock Market.
Asian cues are mixed but not alarming. Nikkei futures near 61,847 reflect continued strength in Japan, while Hang Seng futures at 25,647 remain the softer of the two regional references.
On the macro side, Brent crude at 87.56 is the input that deserves the most attention. Elevated crude is inflationary for a net-importing economy and puts pressure on oil marketing, paint and aviation names while supporting upstream energy.
USD/INR at 95.88 reflects a weaker rupee, which is typically a headwind for foreign flows. The fact that FIIs still bought 2,981.87 crore against that currency backdrop makes the buying more notable, not less.
Sector-wise, the fact that Sensex gained 1.16% and Nifty 1.10% while Bank Nifty managed only 0.79% suggests leadership came from non-banking heavyweights. Information technology, energy and select large-cap industrials are the probable contributors, while private banks lagged.
Putting it together, the Tomorrow Market Prediction is for a range-first, breakout-second session. The base case is an opening inside the support-resistance band on all three indices, with directional resolution likely between 10:15 and 11:30 in the morning session.
Option Matrix India readers should treat this Share Market Prediction as a probability framework. The levels define where risk is cheapest to define, not where price is guaranteed to travel.
Trading Strategy for 30-07-2026 with Scenario Planning
Entry: Above 24286 on a 15-minute close.
Targets: 24365, then 24470, then 24530.
Stop-loss: Below 24200 on a closing basis.
Aligns with Nifty PCR 1.17 and same-side FII/DII buying.
Entry: Below 24200 on a 15-minute close.
Targets: 24135, then 24051, then 23928.
Stop-loss: Above 24286 on a closing basis.
Gains conviction only if the 24,176.65 gap zone breaks.
Entry: No directional trade inside 24200–24286.
Approach: Range strategies suited to VIX 12.0275.
Invalidation: Any sustained close outside the band.
Most probable if GIFT Nifty 24,244 sets a flat open.
False Breakout and False Breakdown Playbook
A 15-minute candle can pierce resistance or support and then fail to sustain, after which the move often reverses and accelerates toward the opposite side of the range. This is one of the most common ways intraday traders get trapped near obvious levels.
If a 15-minute candle closes above resistance but fails to sustain, the first downside reaction should be toward the given support level, then the second and final downside targets should be D1 and then D2/D3 as applicable. On Nifty that path runs 24200, then 24135, then 24051 and 23928.
If a 15-minute candle closes below support but fails to sustain, the first upside reaction should be toward the given resistance level, then the second and final upside targets should be U1 and then U2/U3 as applicable. On Bank Nifty that path runs 57315, then 57564, then 58000 and 58256.
Gap risk warning: in a big gap-up or gap-down session, most of these supplied levels can become invalid very quickly. Treat them as strategic probability zones, not guaranteed outcome lines, and let the first 15-minute candle re-anchor your bias before committing size.
Risk Management and Profit Booking Discipline
The execution rule that separates consistent traders from inconsistent ones is scaling out. Always book 70% of profit at the first target, book the remaining 15% at the second target and the last 15% at the third target, while trailing the stop-loss to protect gains at every stage.
Position sizing should keep single-trade risk within 1% to 2% of capital. With India VIX at 12.0275 the stops can be tighter than in a high-volatility regime, but they must still sit outside routine noise around the level.
Overall Market Sentiment Reading
Bearish Neutral Strongly
Bullish
Current reading: Constructive to mildly bullish — 68 on a 0–100 sentiment scale.
Driven by 1.10% Nifty gain, VIX 12.0275, PCR 1.17 and combined FII/DII buying of about 3,980 crore.
Useful Tools and Resources from Option Matrix India
Frequently Asked Questions on the 30-07-2026 Market Prediction
What is the Nifty Prediction for 30-07-2026?
Nifty support is 24200 and resistance is 24286. If sustained above 24286 the index may move toward 24365, 24470 and 24530, while a break below 24200 could bring 24135, 24051 and 23928 into play.
What is the Bank Nifty Prediction for 30-07-2026?
Bank Nifty support and resistance are 57050 and 57315. Above 57315 the upside targets are 57564, 58000 and 58256; below 57050 the downside targets are 56698, 56347 and 56032.
What is the Sensex Prediction for 30-07-2026?
Sensex support is 77514 and resistance is 77765. A sustained move above resistance may reach 78021, 78288 and 78670, while weakness below support could see 77333, 77095 and 76858.
What does the Nifty PCR of 1.17 indicate?
A PCR of 1.17 shows put open interest exceeding call open interest, which is mildly bullish. It suggests put writers are confident and dips toward 24200 may find support, though it is a sentiment gauge rather than a timing tool.
How should traders read India VIX at 12.0275?
A VIX near 12 indicates a low-volatility environment with compressed option premiums. It favours range-based and premium-selling strategies, but a spike above roughly 13.5 would signal rising risk and wider intraday swings.
What is the Tomorrow Market Prediction based on global cues?
GIFT Nifty at 24,244, Dow futures at 51,910, Nasdaq futures at 27,413 and S&P 500 futures at 7,367 point to a flat opening. Nikkei futures at 61,847 and Hang Seng futures at 25,647 provide mixed Asian cues.
How should profits be booked using these levels?
Book 70% of profit at the first target, 15% at the second target and the final 15% at the third target, trailing the stop-loss at each stage so that gains are protected if the move reverses.
Do these levels stay valid on a big gap-up or gap-down?
No. On a large gap open most supplied levels can become invalid quickly. They should be treated as probability zones, and traders should wait for the first 15-minute candle to re-establish structure before acting.
Conclusion: Technical Analysis Summary and Market Outlook
This Technical Analysis leaves the Nifty Prediction, Bank Nifty Prediction and Sensex Prediction aligned on the same constructive to mildly bullish bias, with confirmation required above 24286, 57315 and 77765 respectively.
The supporting evidence — a Nifty PCR of 1.17, India VIX at 12.0275, and combined FII and DII buying of nearly 3,980 crore — favours the upside. The counterweights are a Bank Nifty PCR of 0.89, USD/INR at 95.88 and Brent crude at 87.56.
Trade the levels, respect the invalidation points, scale out at each target and let the market confirm before adding risk. Option Matrix India will publish an updated Technical Market Outlook after the next session close.
Disclaimer: This article is published by Option Matrix India for educational and informational purposes only and does not constitute investment advice, a recommendation, or an offer to buy or sell any security. All levels, targets and observations are probability-based technical estimates derived from publicly available data and may change without notice. Trading in equities, futures and options involves substantial risk of loss. Past performance is not indicative of future results. Readers should conduct independent research and consult a SEBI-registered investment adviser before taking any position. Option Matrix India and its authors accept no liability for any loss arising from the use of this content.